Fig. 3
Download original image
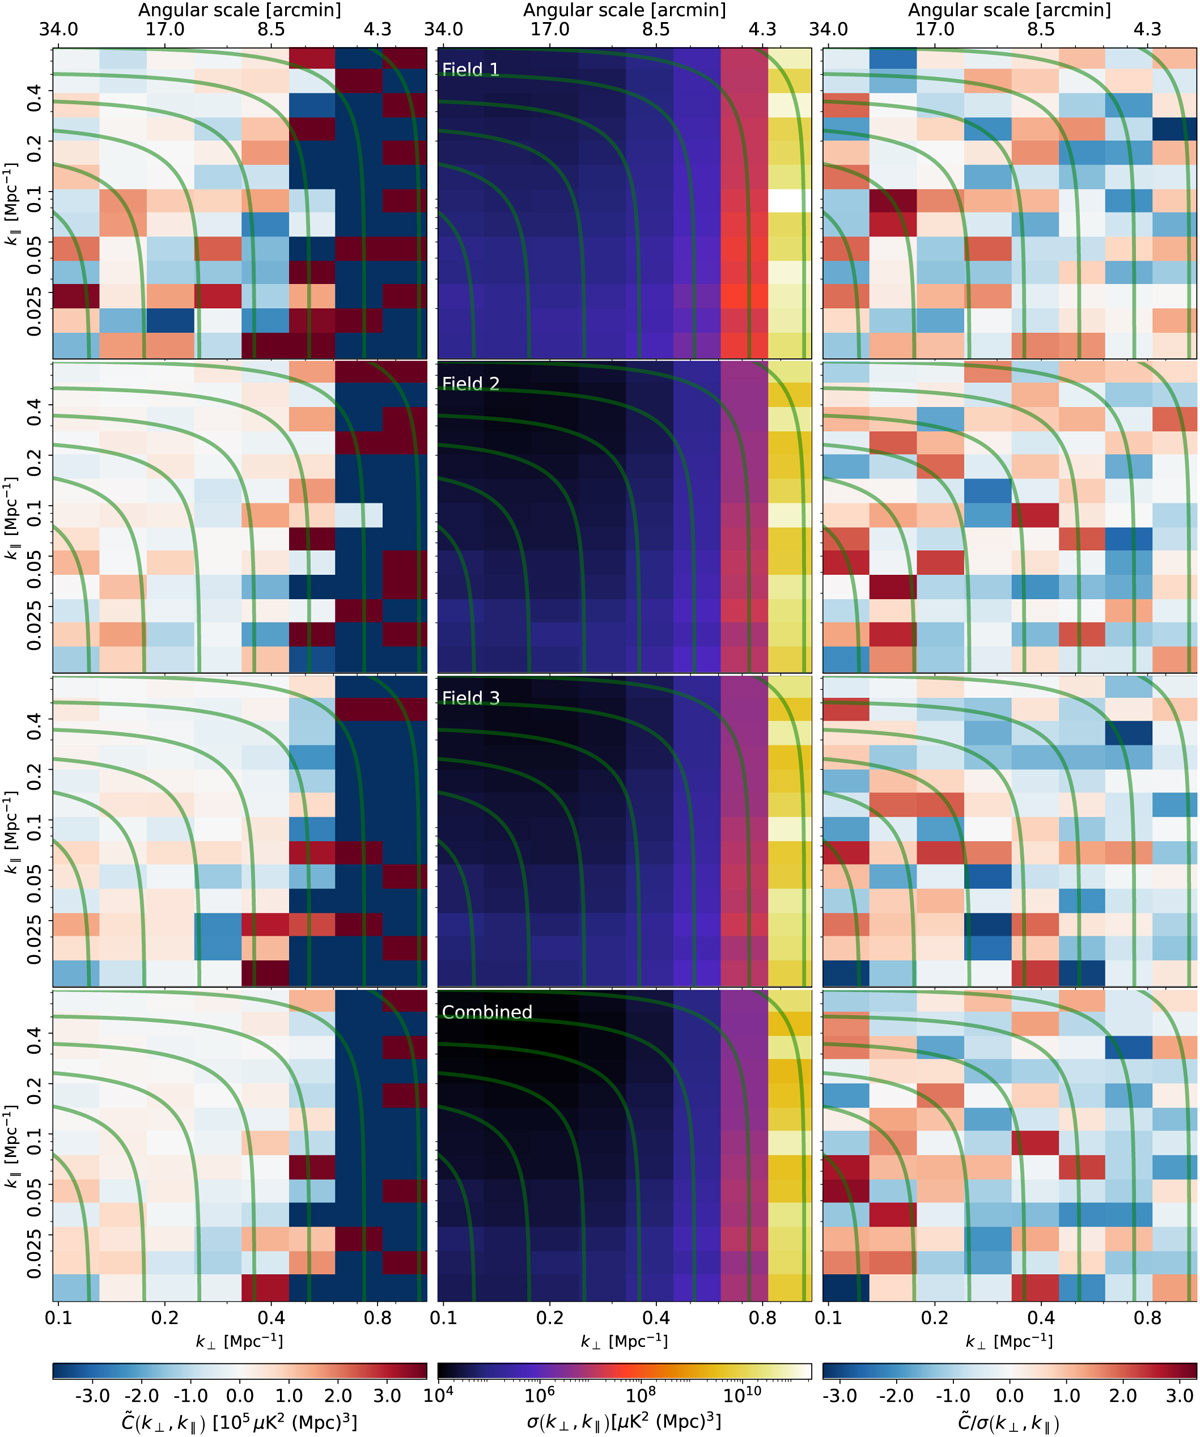
Cylindrically averaged (2D) feed group pseudo-cross-spectra. Columns show, from left to right, the full spectra, the corresponding 1σ uncertainty, and the ratio between the two. Rows show, from top to bottom, Fields 1, 2, 3, and all three combined. The approximate angular scale, assuming the central COMAP redshift at z = 2.9, corresponding to each k⊥ is shown as a twin axis on the upper row of plots. Thin green contours indicate the bin edges of the (1D) spherically averaged FGPXS.
Current usage metrics show cumulative count of Article Views (full-text article views including HTML views, PDF and ePub downloads, according to the available data) and Abstracts Views on Vision4Press platform.
Data correspond to usage on the plateform after 2015. The current usage metrics is available 48-96 hours after online publication and is updated daily on week days.
Initial download of the metrics may take a while.