Fig. 1
Download original image
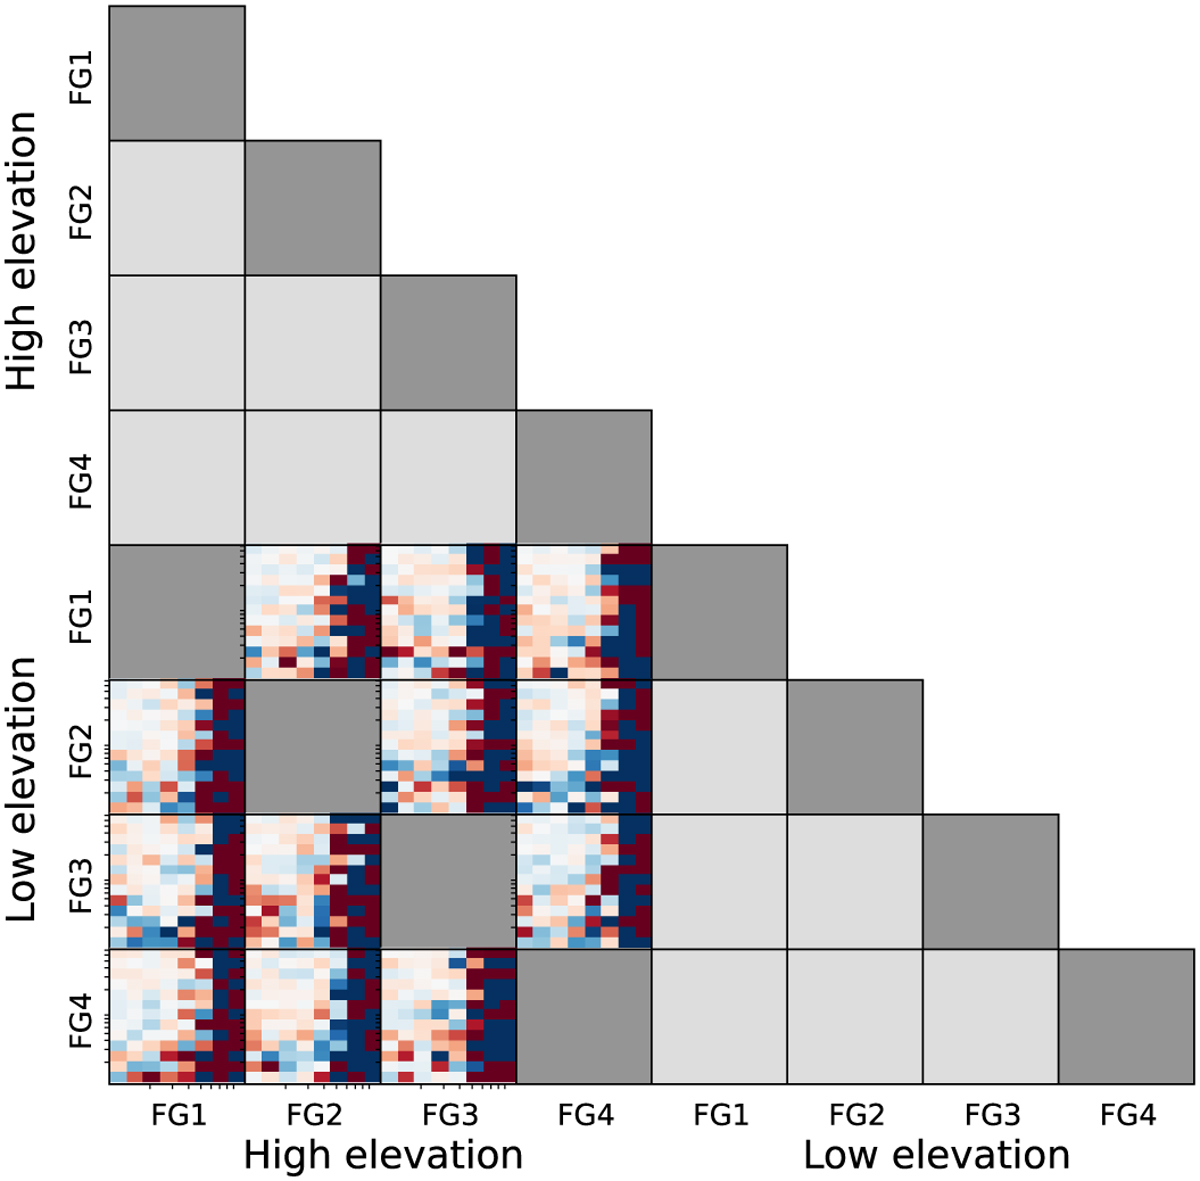
Example grid of possible feed group (FG1–4) and elevation (high and low) split combinations. Combinations with dark and light gray shading, respectively, represent auto-feed group and auto-elevation combinations that are not used in the final averaged FGPXS. The crosscombinations containing examples of a 2D cross-spectrum contribute to the final average FGPXS as neither identical feed groups, nor elevations, are crossed.
Current usage metrics show cumulative count of Article Views (full-text article views including HTML views, PDF and ePub downloads, according to the available data) and Abstracts Views on Vision4Press platform.
Data correspond to usage on the plateform after 2015. The current usage metrics is available 48-96 hours after online publication and is updated daily on week days.
Initial download of the metrics may take a while.