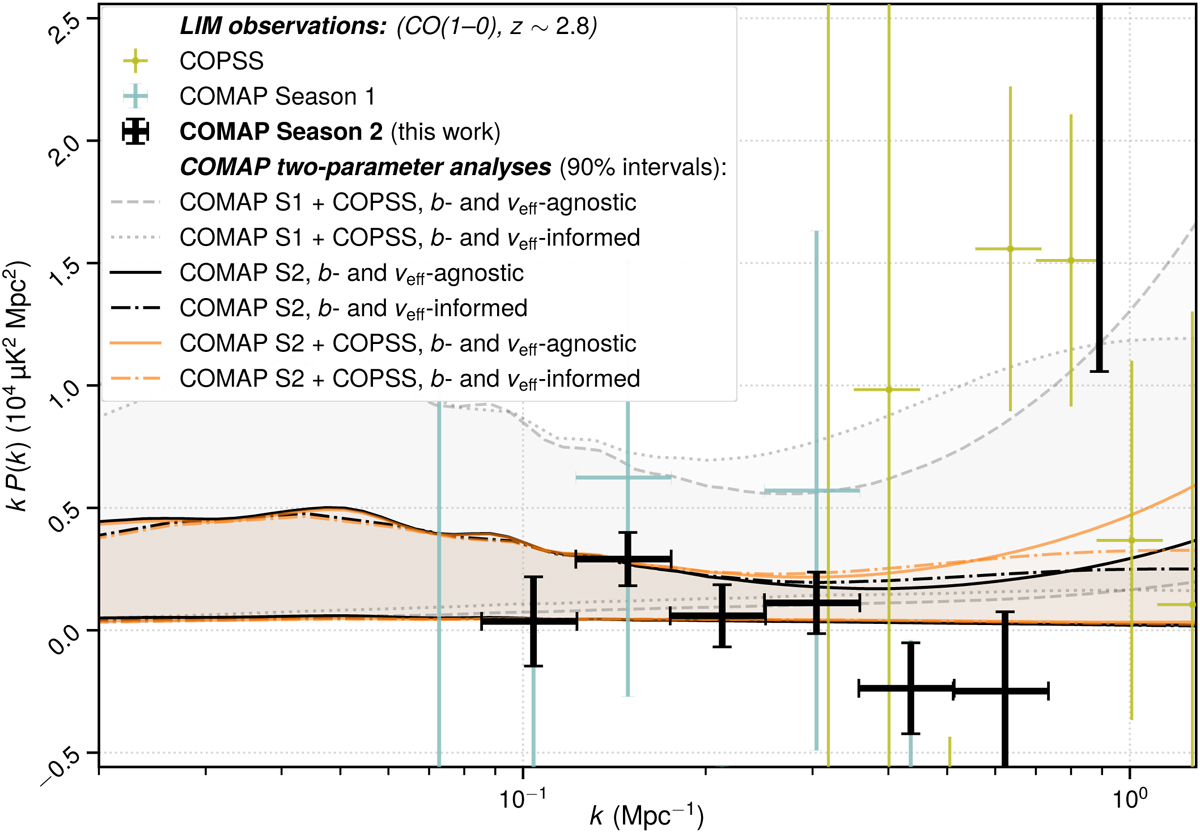
Fig. A.1
Download original image
Same as Fig. 1, but with all LIM P(k) results shown with 1σ uncertainties per k-bin and on a linear scale. Furthermore, instead of the specific models shown in Fig. 1, we show the typical range of allowable power spectrum values based on the two-parameter analyses of Sect. 3, with the b-/veff-informed variations showing attenuation for line broadening left uncorrected. These allowable ranges shown should not be taken to represent a detection as they assume non-negative P(k) values by definition.
Current usage metrics show cumulative count of Article Views (full-text article views including HTML views, PDF and ePub downloads, according to the available data) and Abstracts Views on Vision4Press platform.
Data correspond to usage on the plateform after 2015. The current usage metrics is available 48-96 hours after online publication and is updated daily on week days.
Initial download of the metrics may take a while.