Fig. 2
Download original image
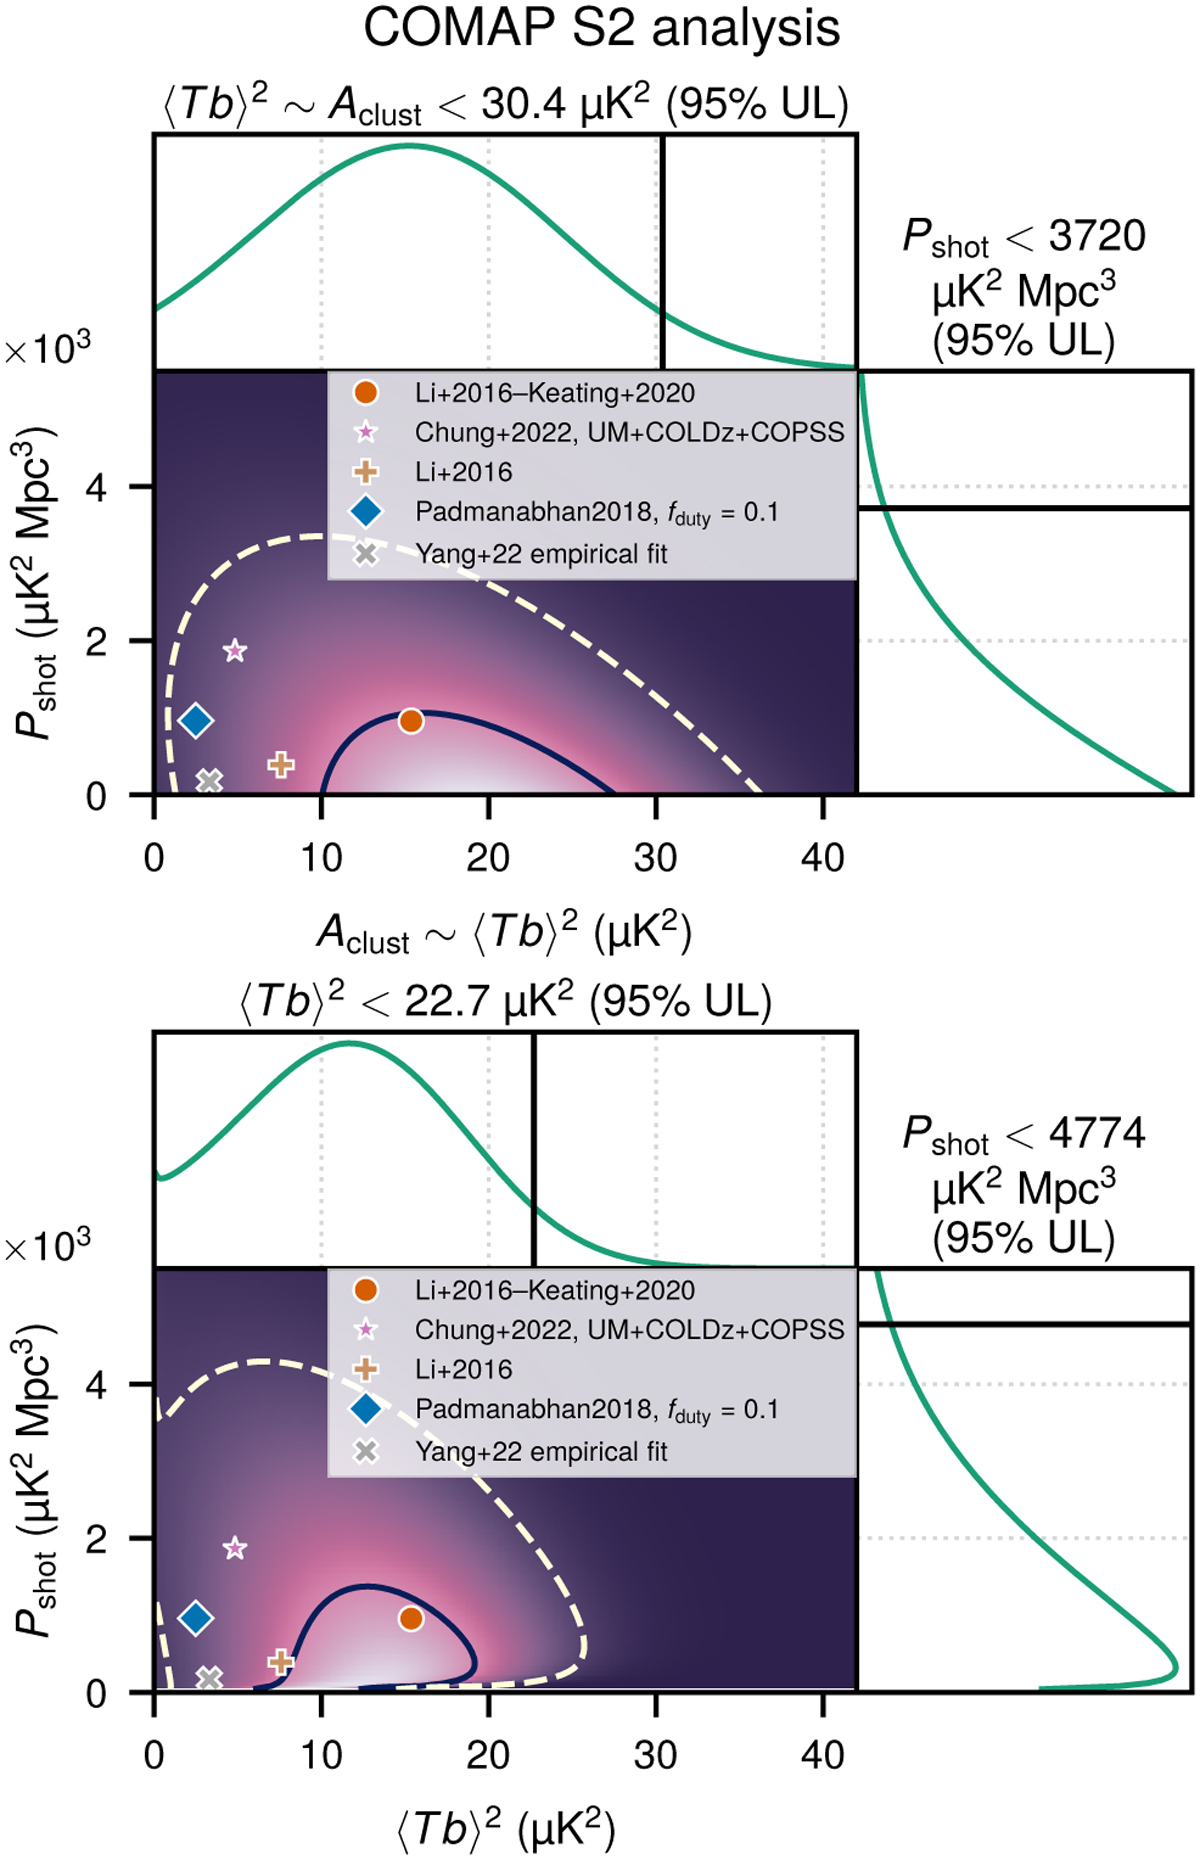
Likelihood contours and marginalized probability distributions for the clustering and shot-noise amplitudes of the CO power spectrum, conditioned on COMAP Season 2 data, in b- and veff-agnostic (upper) and -informed (lower) analyses. Black solid lines plotted with the 1D marginalized distributions indicate the 95% upper limits for each parameter. The solid and dashed 2D contours are meant to encompass 39% and 86% of the probability mass (delineated at Δχ2 = {1, 4} relative to the minimum χ2, corresponding to 1σ and 2σ for 2D Gaussians). We show the clustering and shot noise amplitudes for a subset of the models plotted in Fig. 1. Models shown in Fig. 1 but not shown here have values of Aclust or ⟨T b⟩2 well beyond the 2σ regions shown.
Current usage metrics show cumulative count of Article Views (full-text article views including HTML views, PDF and ePub downloads, according to the available data) and Abstracts Views on Vision4Press platform.
Data correspond to usage on the plateform after 2015. The current usage metrics is available 48-96 hours after online publication and is updated daily on week days.
Initial download of the metrics may take a while.