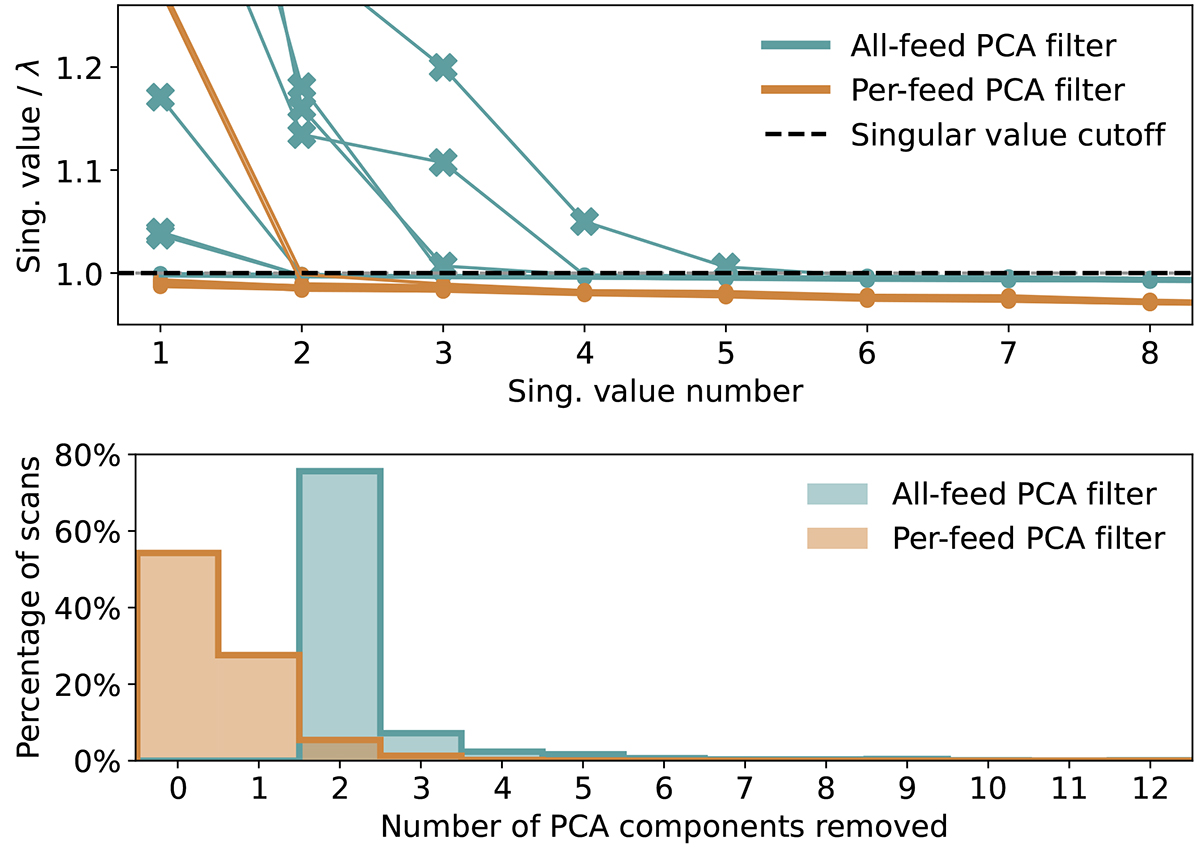
Fig. 8.
Download original image
Top: largest singular values of the all-feed and per-feed PCA filters, divided by λ, for a random selection of ten scans. PCA components with relative values above one are removed from the data and are marked with crosses in this plot. Bottom: number of PCA components subtracted across all scans. At least two components are always subtracted by the all-feed PCA filter.
Current usage metrics show cumulative count of Article Views (full-text article views including HTML views, PDF and ePub downloads, according to the available data) and Abstracts Views on Vision4Press platform.
Data correspond to usage on the plateform after 2015. The current usage metrics is available 48-96 hours after online publication and is updated daily on week days.
Initial download of the metrics may take a while.