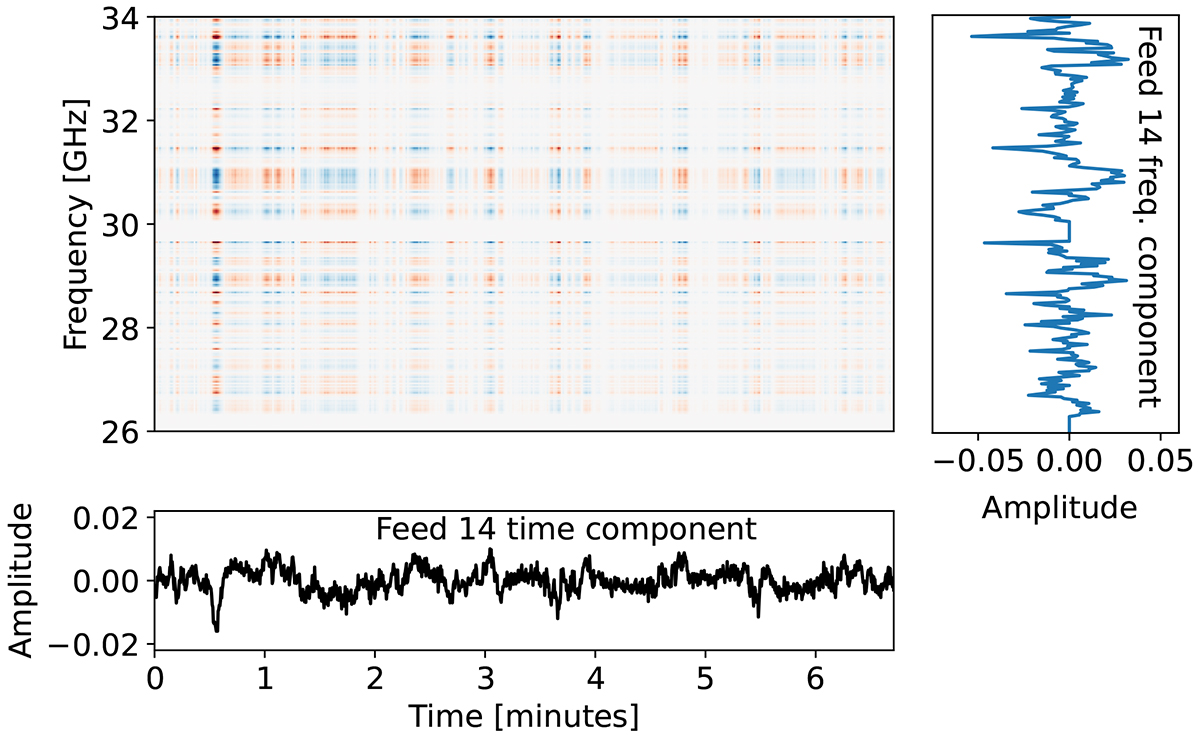
Fig. 7.
Download original image
Most significant component and amplitude of the per-feed PCA filter applied on scan 3354205. The bottom plot shows the first PCA component wi0 for feed 14, while the right plot shows the corresponding amplitude ai0 for feed 14. The other product of the two quantities are shown in the center plot, with colorbar limits of ±5 × 10⁻⁴.
Current usage metrics show cumulative count of Article Views (full-text article views including HTML views, PDF and ePub downloads, according to the available data) and Abstracts Views on Vision4Press platform.
Data correspond to usage on the plateform after 2015. The current usage metrics is available 48-96 hours after online publication and is updated daily on week days.
Initial download of the metrics may take a while.