Fig. 3.
Download original image
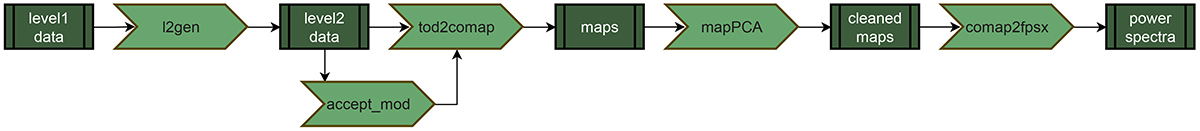
Flowchart of the COMAP pipeline, from raw Level1 data to final power spectra. Data products are shown as darker boxes and pipeline code as lighter arrows. l2gen performs the time-domain filtering, turning raw data into cleaned Level 2 files. accept_mod performs scan-level data selection on cleaned data. tod2comap is a simple binned mapmaker. mapPCA performs a map-level PCA filtering. Finally, comap2fpsx calculates power spectra as described by Stutzer et al. (2024).
Current usage metrics show cumulative count of Article Views (full-text article views including HTML views, PDF and ePub downloads, according to the available data) and Abstracts Views on Vision4Press platform.
Data correspond to usage on the plateform after 2015. The current usage metrics is available 48-96 hours after online publication and is updated daily on week days.
Initial download of the metrics may take a while.