Fig. D.1.
Download original image
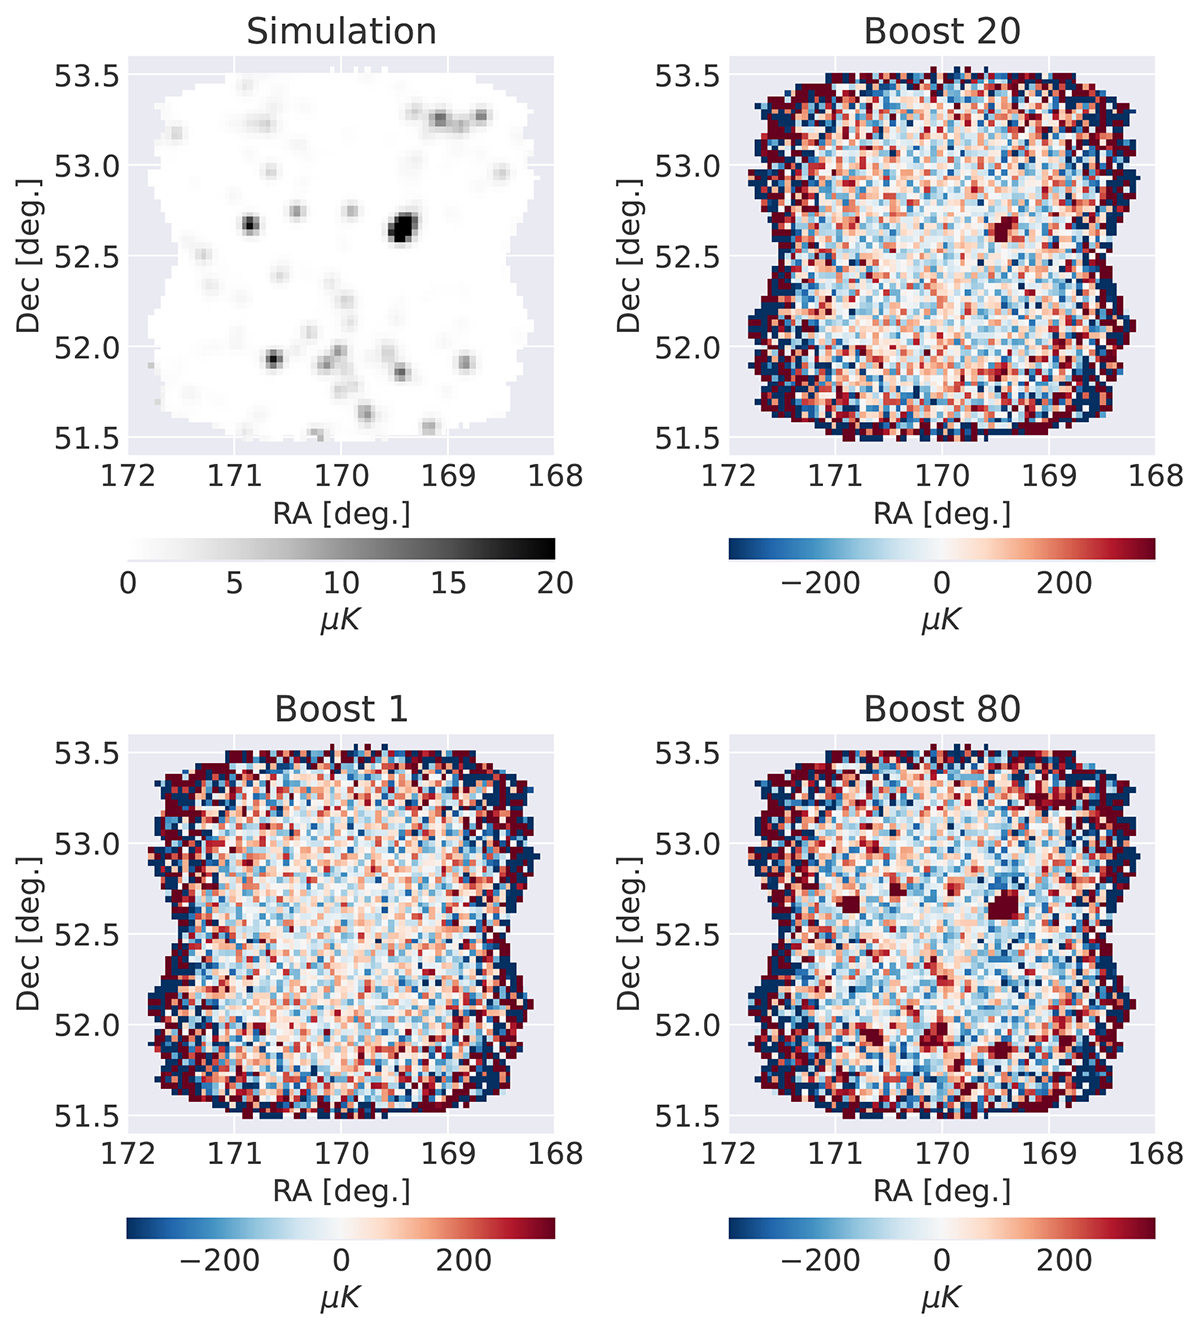
Illustration of the signal-injection method for transfer function analysis for different signal boost strengths. The top left plot shows the signal-only CO simulation over the relevant patch. The remaining plots show the resulting maps of the simulation injected into the real TOD with different boost strengths and passed through the entire COMAP pipeline. The boost is relative to the fiducial model of Chung et al. (2022), used in the simulations. All four plots show the same frequency slice centered at 26.953GHz.
Current usage metrics show cumulative count of Article Views (full-text article views including HTML views, PDF and ePub downloads, according to the available data) and Abstracts Views on Vision4Press platform.
Data correspond to usage on the plateform after 2015. The current usage metrics is available 48-96 hours after online publication and is updated daily on week days.
Initial download of the metrics may take a while.