Fig. 17.
Download original image
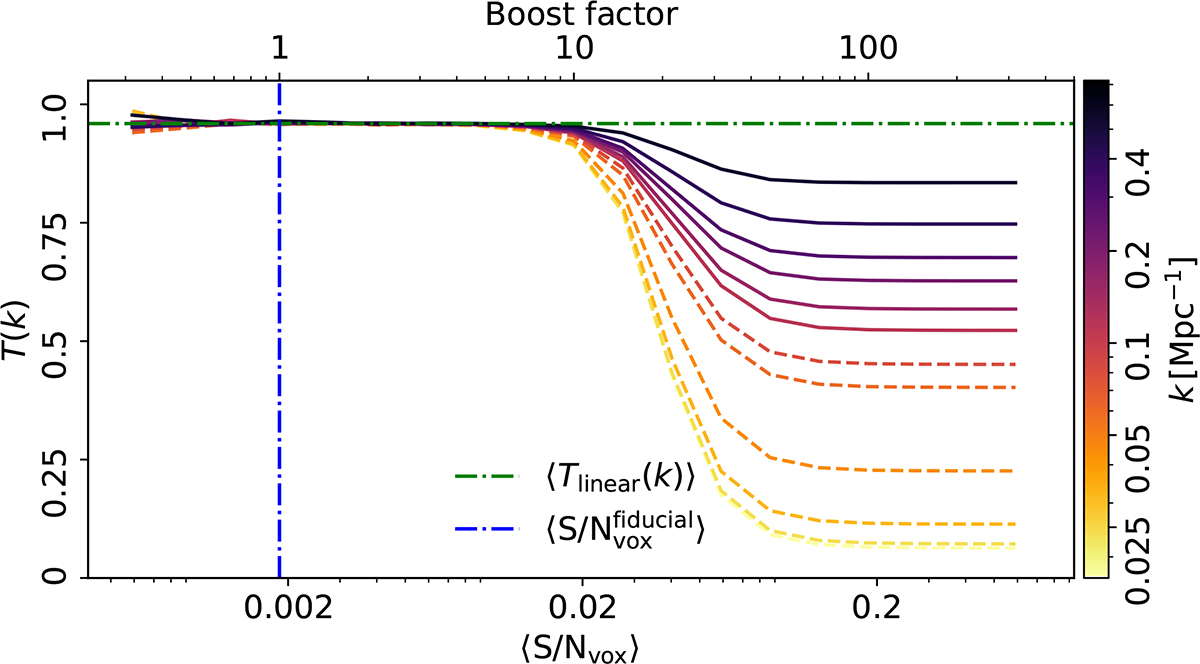
Map PCA transfer function T(k) as a function of the voxel S/N, with the different k-scales shown as differently colored lines. The equivalent boost used to the fiducial CO model is shown as the top x-axis. Modes with k-values that fall within the analysis bounds are shown as solid, while modes outside the scope of COMAP Season 2 are shown as striped. The horizontal green line shows the average transfer function in the low-S/N regime, which is 0.96. The vertical blue line shows the S/N that the maps would have if the fiducial model of Chung et al. (2022) perfectly described the true CO signal.
Current usage metrics show cumulative count of Article Views (full-text article views including HTML views, PDF and ePub downloads, according to the available data) and Abstracts Views on Vision4Press platform.
Data correspond to usage on the plateform after 2015. The current usage metrics is available 48-96 hours after online publication and is updated daily on week days.
Initial download of the metrics may take a while.