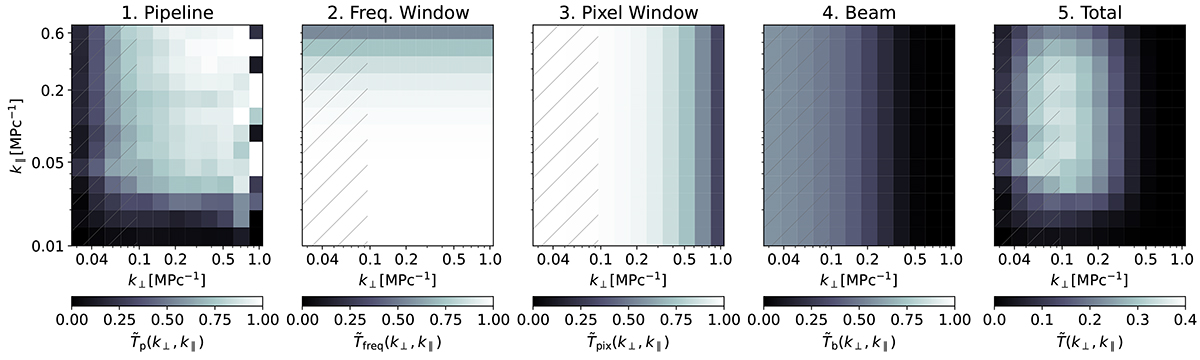
Fig. 15.
Download original image
Effective transfer functions used in the COMAP pipeline. From left to right, the five panels show 1) the filter transfer function, Tf(k), quantifying signal loss due to pipeline filters; 2) the pixel window transfer function Tpix(k) resulting from binning the TOD into a pixel grid; 3) the frequency window transfer function, Tfreq(k), resulting from data down-sampling in frequency; 4) the beam smoothing transfer function, Tb(k); and 5) the full combined transfer function, T(k), corresponding to the product of the four individual transfer functions. The striped region to the left is not used for our final analysis but is shown for completeness. We note that the leftmost panel has a colorbar that saturates at 0.4, unlike the other four.
Current usage metrics show cumulative count of Article Views (full-text article views including HTML views, PDF and ePub downloads, according to the available data) and Abstracts Views on Vision4Press platform.
Data correspond to usage on the plateform after 2015. The current usage metrics is available 48-96 hours after online publication and is updated daily on week days.
Initial download of the metrics may take a while.