Open Access
Fig. 14.
Download original image
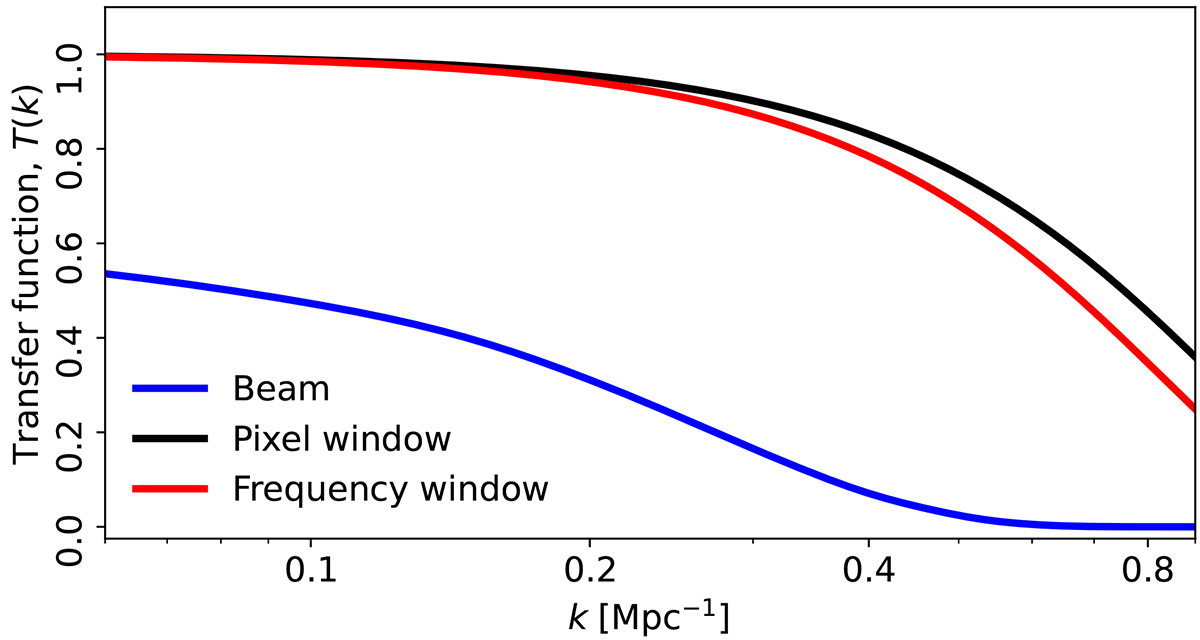
Effective one-dimensional transfer functions for the instrumental beam (blue curve), pixel window (black curve), and frequency window (red curve) resulting from spherical averaging over the corresponding two-dimensional transfer functions shown in Fig. 15.
Current usage metrics show cumulative count of Article Views (full-text article views including HTML views, PDF and ePub downloads, according to the available data) and Abstracts Views on Vision4Press platform.
Data correspond to usage on the plateform after 2015. The current usage metrics is available 48-96 hours after online publication and is updated daily on week days.
Initial download of the metrics may take a while.