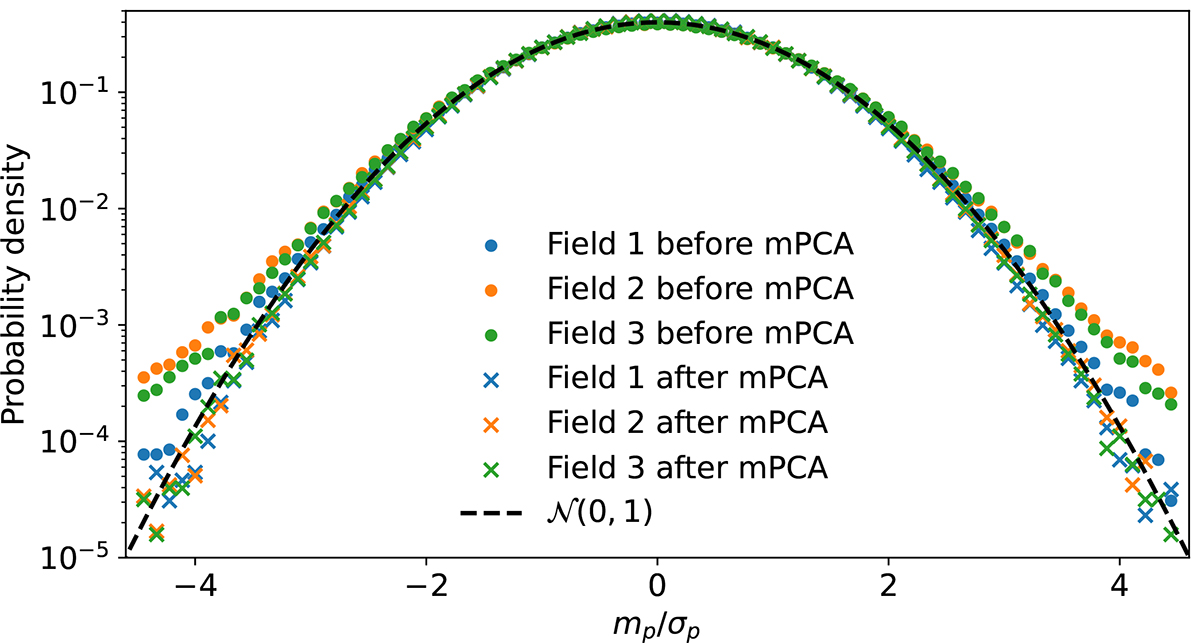
Fig. 12.
Download original image
Histogram of all map pixel temperature values across all feeds and frequencies, divided by their white noise uncertainty. The three fields are shown separately, before and after application of the map PCA filter. A normal distribution is shown in black; a completely white noise map will trace this distribution. All three fields show excess high-significance pixels before the map PCA. After the filter, all three fields fall slightly below the normal distribution on the wings, because of the slight over-subtraction of noise at various stages in the pipeline.
Current usage metrics show cumulative count of Article Views (full-text article views including HTML views, PDF and ePub downloads, according to the available data) and Abstracts Views on Vision4Press platform.
Data correspond to usage on the plateform after 2015. The current usage metrics is available 48-96 hours after online publication and is updated daily on week days.
Initial download of the metrics may take a while.