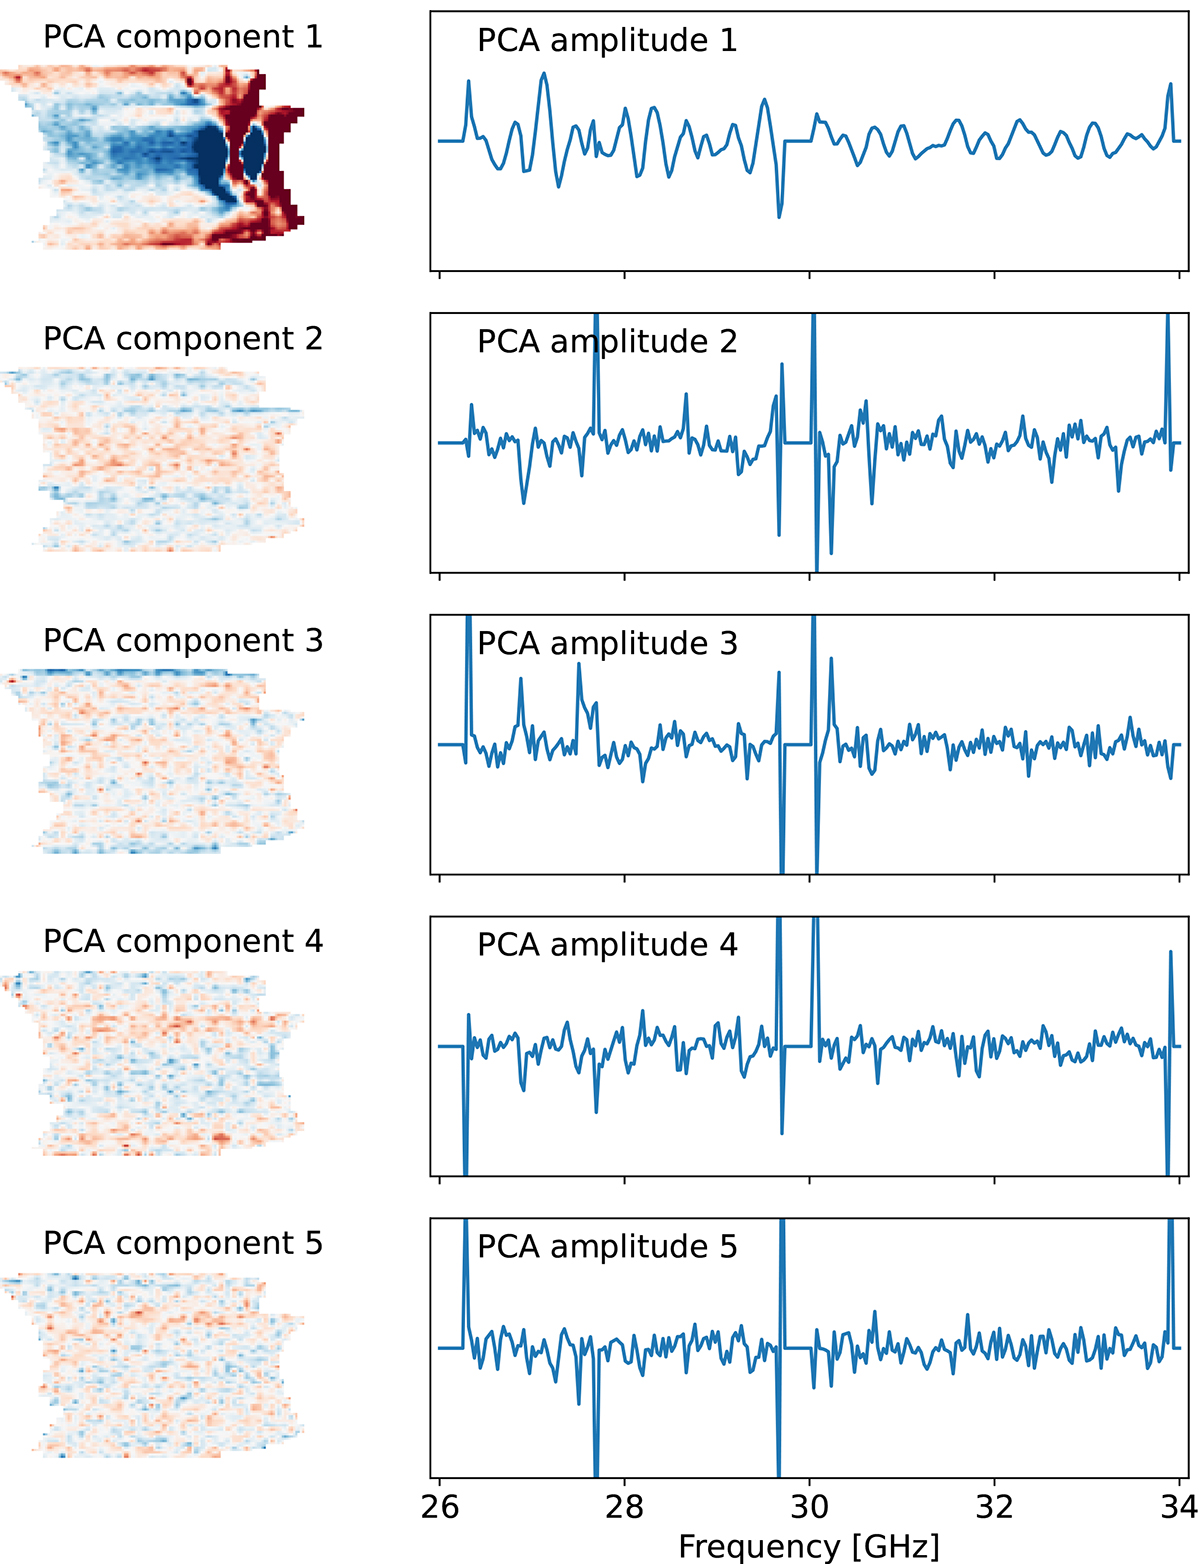
Fig. 11.
Download original image
Leading PCA components vk (left) and their respective frequency amplitudes ak (right) for Field 2 as observed by feed 6 prior to the map-PCA filter; this feed is the most sensitive to pointing-correlated systematics. All maps are divided by their respective uncertainties to highlight the key morphology. All rows share the same color range and y-axis scale, but the specific values have been omitted as they are not easily interpretable.
Current usage metrics show cumulative count of Article Views (full-text article views including HTML views, PDF and ePub downloads, according to the available data) and Abstracts Views on Vision4Press platform.
Data correspond to usage on the plateform after 2015. The current usage metrics is available 48-96 hours after online publication and is updated daily on week days.
Initial download of the metrics may take a while.