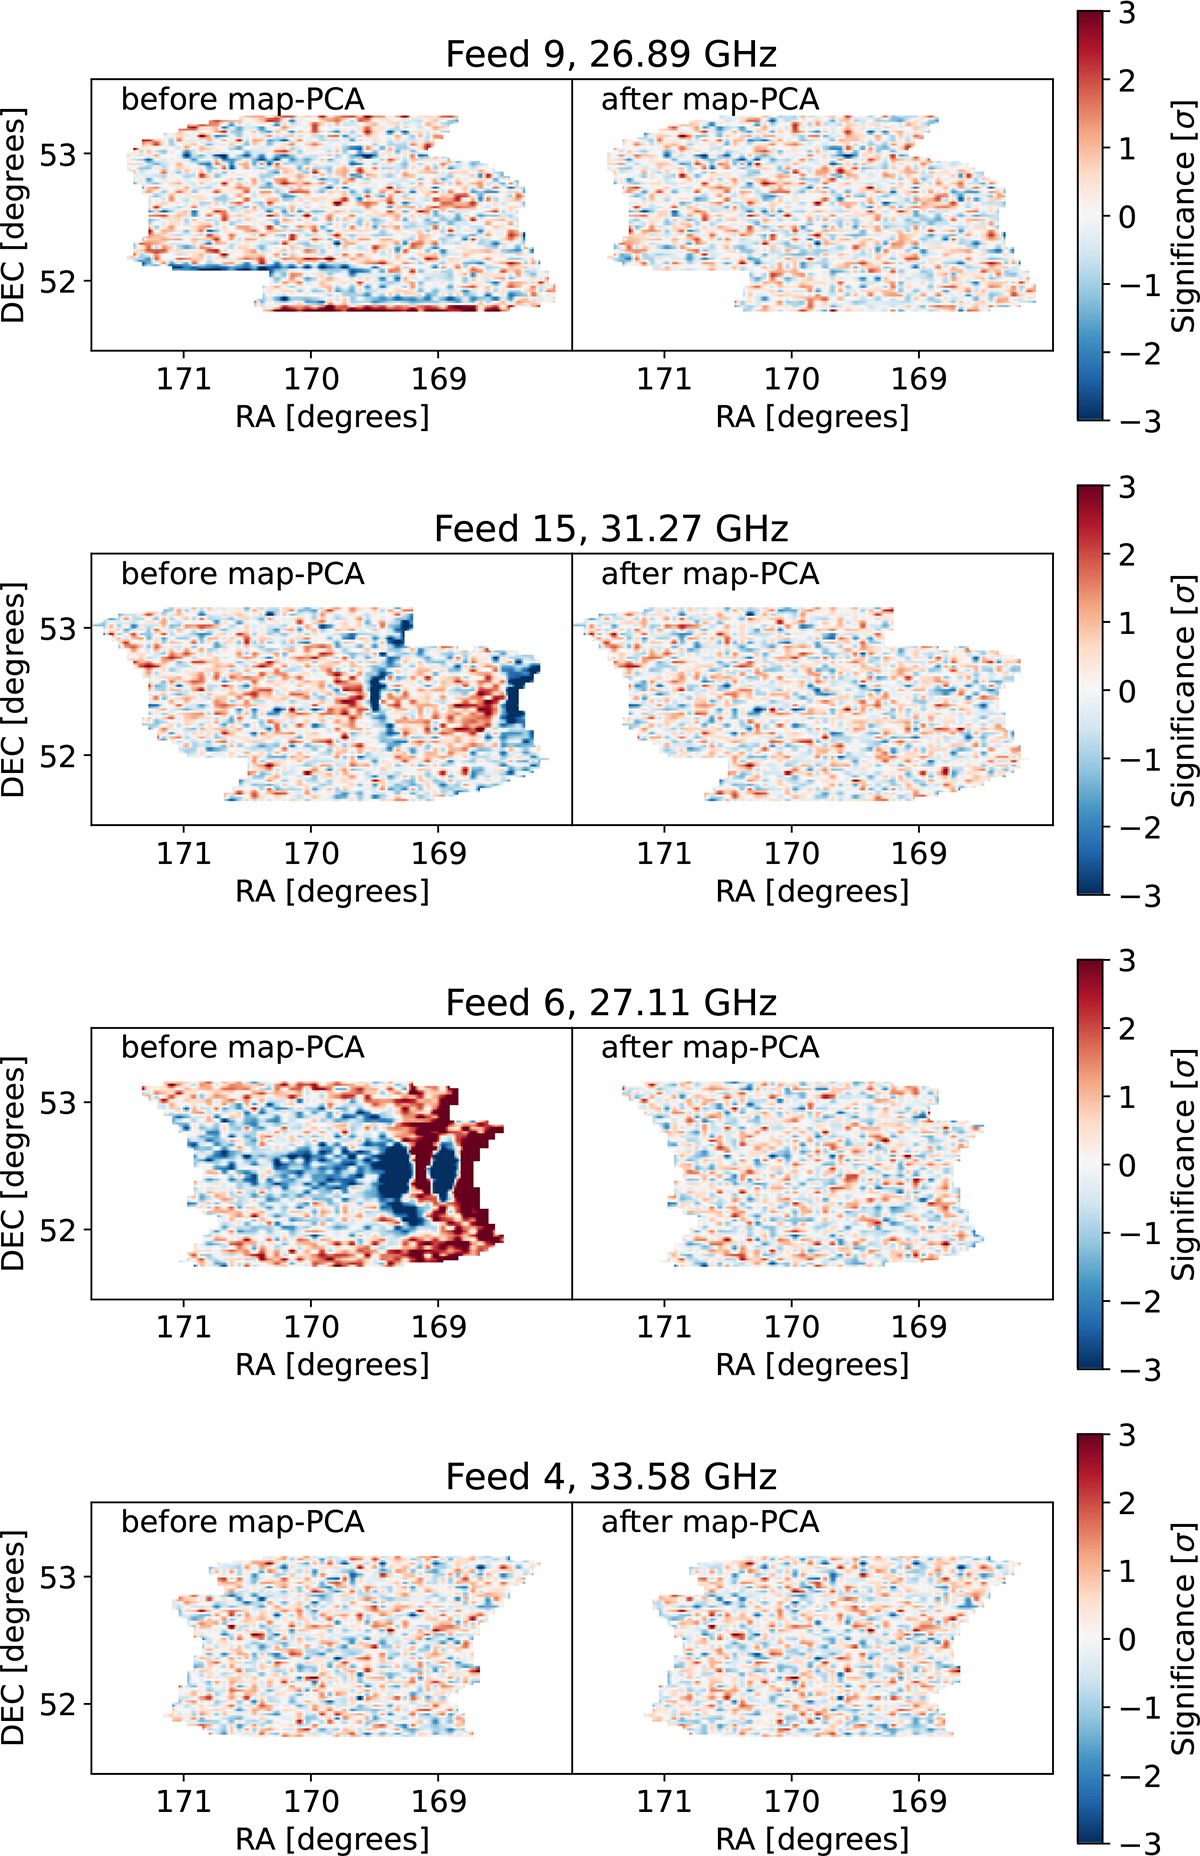
Fig. 10.
Download original image
Selection of individual frequency maps from Field 2 before (left) and after (right) the map-domain PCA filter. Because of the uneven sensitivity among the pixels, and to emphasize the relevant systematic effects, all maps have been divided by their white noise uncertainty. From top to bottom, each row shows maps that are dominated by (1) the turn-around effect; (2) the start-of-scan effect; (3) both effects simultaneously; and (4) neither effect. Both effects appear to manifest twice, on two slightly offset maps. This offset effect originates from the physical placement of the feeds, as they observe the fields as they are both rising and setting on the sky. In the equatorial coordinate system of these maps, the telescope scans vertically, and the field drifts from left to right.
Current usage metrics show cumulative count of Article Views (full-text article views including HTML views, PDF and ePub downloads, according to the available data) and Abstracts Views on Vision4Press platform.
Data correspond to usage on the plateform after 2015. The current usage metrics is available 48-96 hours after online publication and is updated daily on week days.
Initial download of the metrics may take a while.