Fig. 4
Download original image
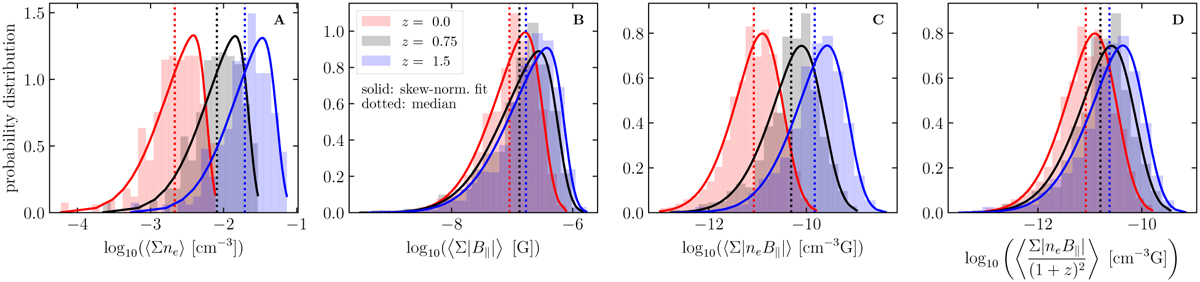
Average distribution of the sum along the line of sight (x-axis) of the electron density (A), the parallel component of the magnetic field (B). the product of those two quantities (C), and the product divided by the (1 +z)−2 contribution, for Ntree = 103 MTs of our model with Mclust = 1015M⊙. In the same panel, each distribution corresponds to a given redshift value. Each histogram is fitted with a skew-normal distribution (see Appendix C of Rappaz & Schober 2024) which is shown in solid lines and the median value of the latter is displayed in dotted lines, to highlight which parameter amongst the electron density and the line-of-sight component of the magnetic field has the most influence on the rotation measure. It appears that if the contribution of the expansion of the universe is not taken into account, the distribution of thermal electron density is dominant. With the expansion, the RM shows minor variations.
Current usage metrics show cumulative count of Article Views (full-text article views including HTML views, PDF and ePub downloads, according to the available data) and Abstracts Views on Vision4Press platform.
Data correspond to usage on the plateform after 2015. The current usage metrics is available 48-96 hours after online publication and is updated daily on week days.
Initial download of the metrics may take a while.