Fig. 2
Download original image
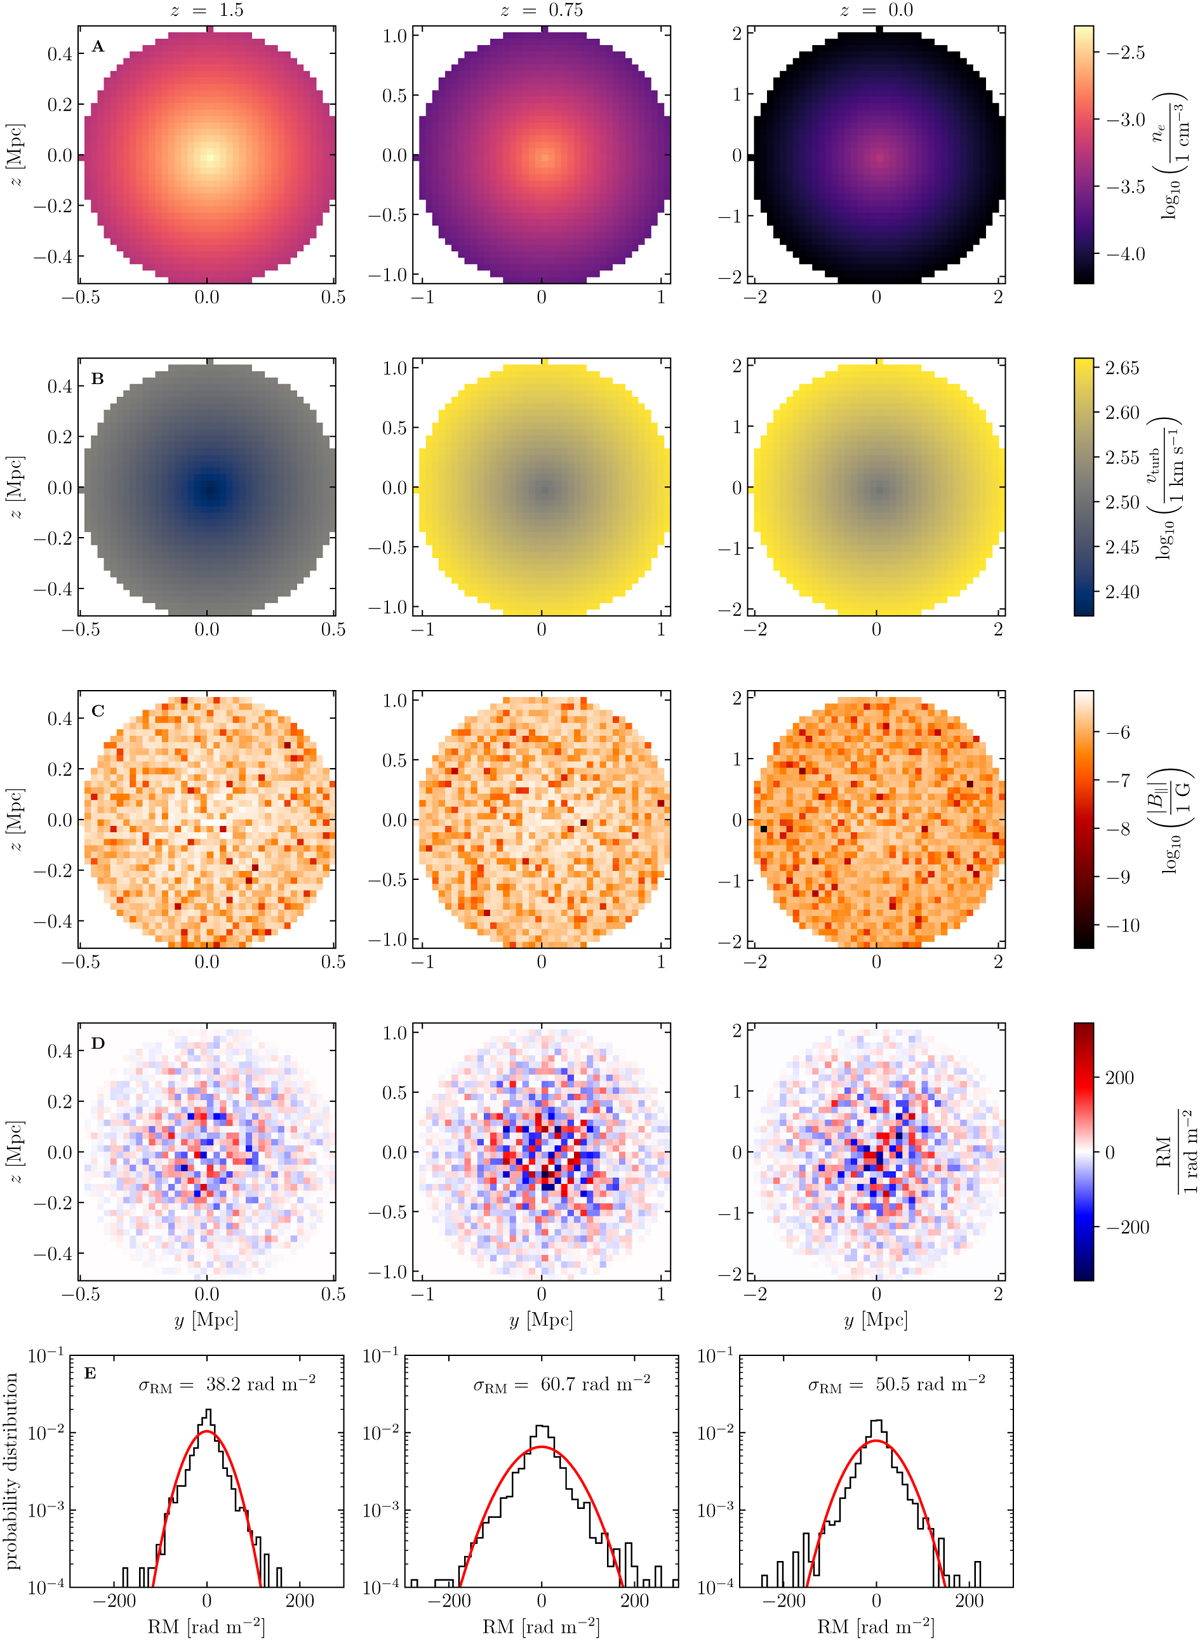
Spatial distribution of characteristic quantities for one realization of a merger tree. The example shows a cluster with Mclust = 1015 M⊙ at ɀ = 0, which has been modelled starting at ɀmax = 4. Each column corresponds to a different value of redshift, as indicated on top. (A) Central 2D slice of the 3D distribution of the electron density. (B) Central 2D slice of the 3D distribution of the turbulent velocity. (C) Central 2D slice of the 3D distribution of the line-of-sight component of the magnetic field. (D) Rotation measure map. (E) Probability distribution function of the RM maps. The red lines correspond to a fit of the histogram data with a Gaussian distribution with the corresponding standard deviation of the Gaussian distribution, σRM, shown in the legend. The mean of the RM distribution is ≈0 rad m−2, as expected for the random magnetic fields.
Current usage metrics show cumulative count of Article Views (full-text article views including HTML views, PDF and ePub downloads, according to the available data) and Abstracts Views on Vision4Press platform.
Data correspond to usage on the plateform after 2015. The current usage metrics is available 48-96 hours after online publication and is updated daily on week days.
Initial download of the metrics may take a while.