Fig. B.1
Download original image
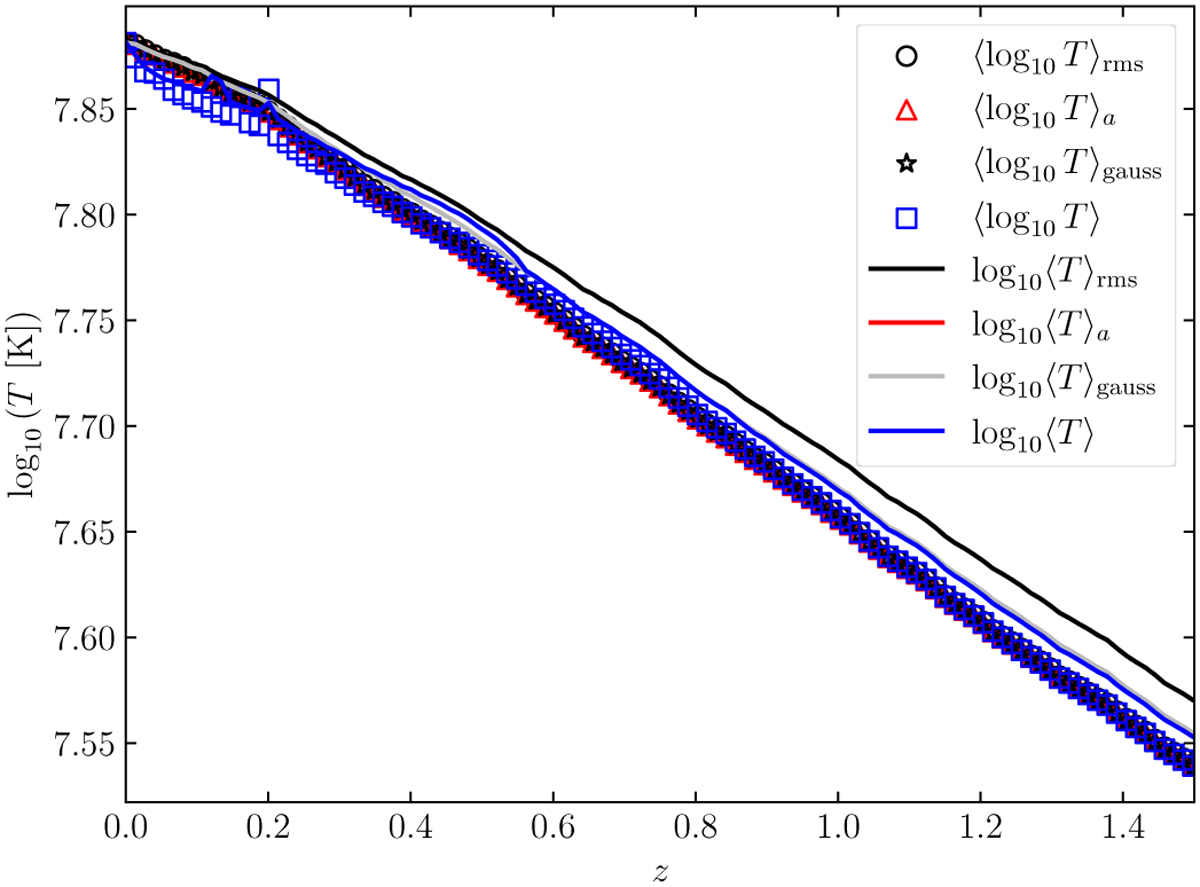
Evolution of the temperature T for Mclust = 1015 M⊙ and ɀmax calculated in different ways. The lines correspond to the arithmetic mean 〈〉a, the root-mean-square 〈〉rms, the median of a skew-normal fitting 〈〉, and the average of a Gaussian fitting 〈〉gauss, for which the logarithm was taken. The markers correspond to the same average processes but are performed on the logarithmic values of T.
Current usage metrics show cumulative count of Article Views (full-text article views including HTML views, PDF and ePub downloads, according to the available data) and Abstracts Views on Vision4Press platform.
Data correspond to usage on the plateform after 2015. The current usage metrics is available 48-96 hours after online publication and is updated daily on week days.
Initial download of the metrics may take a while.