Fig. 1
Download original image
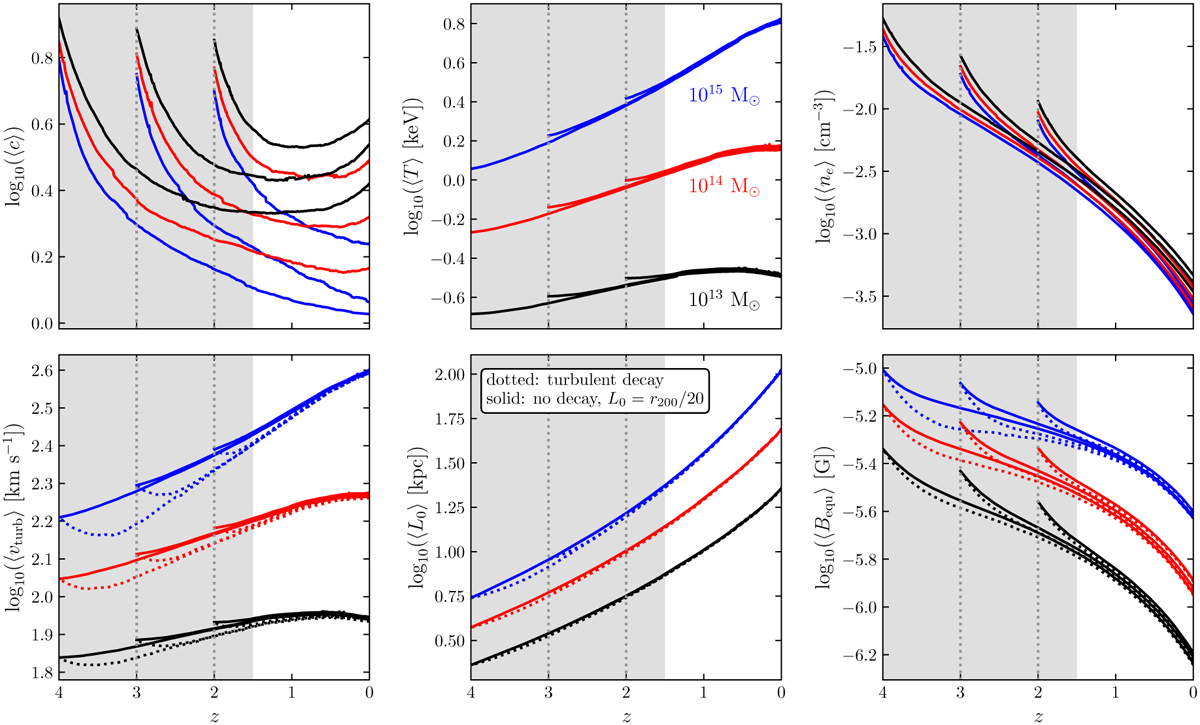
Evolution of the concentration parameter c, the temperature T, the electron density ne, the turbulent velocity υturb, the turbulent driving scale L0, and the equipartition magnetic field Bequ, as a function of the redshift ɀ. Each colour represents a different merger tree configuration with a given mass Mcıust of our modelled cluster at z = 0. The mass resolution is the same in all cases, i.e. Mcıust/Mres = 10−3. Each merger tree mass configuration is also computed for ɀmax = 2-4, where vertical grey dotted lines represent the starting point of the merging process. The solid lines represent the evolution of the plasma quantities without turbulent decay. The coloured dotted lines correspond to the evolution of plasma quantities with turbulent decay according to power laws given by Eqs. (9) and (10). Each line represents, at a given redshift, the skew-normal median of Ntree = 103 merger trees. The grey area corresponds to the part of the merger trees we neglect in the subsequent analysis.
Current usage metrics show cumulative count of Article Views (full-text article views including HTML views, PDF and ePub downloads, according to the available data) and Abstracts Views on Vision4Press platform.
Data correspond to usage on the plateform after 2015. The current usage metrics is available 48-96 hours after online publication and is updated daily on week days.
Initial download of the metrics may take a while.