Fig. 10
Download original image
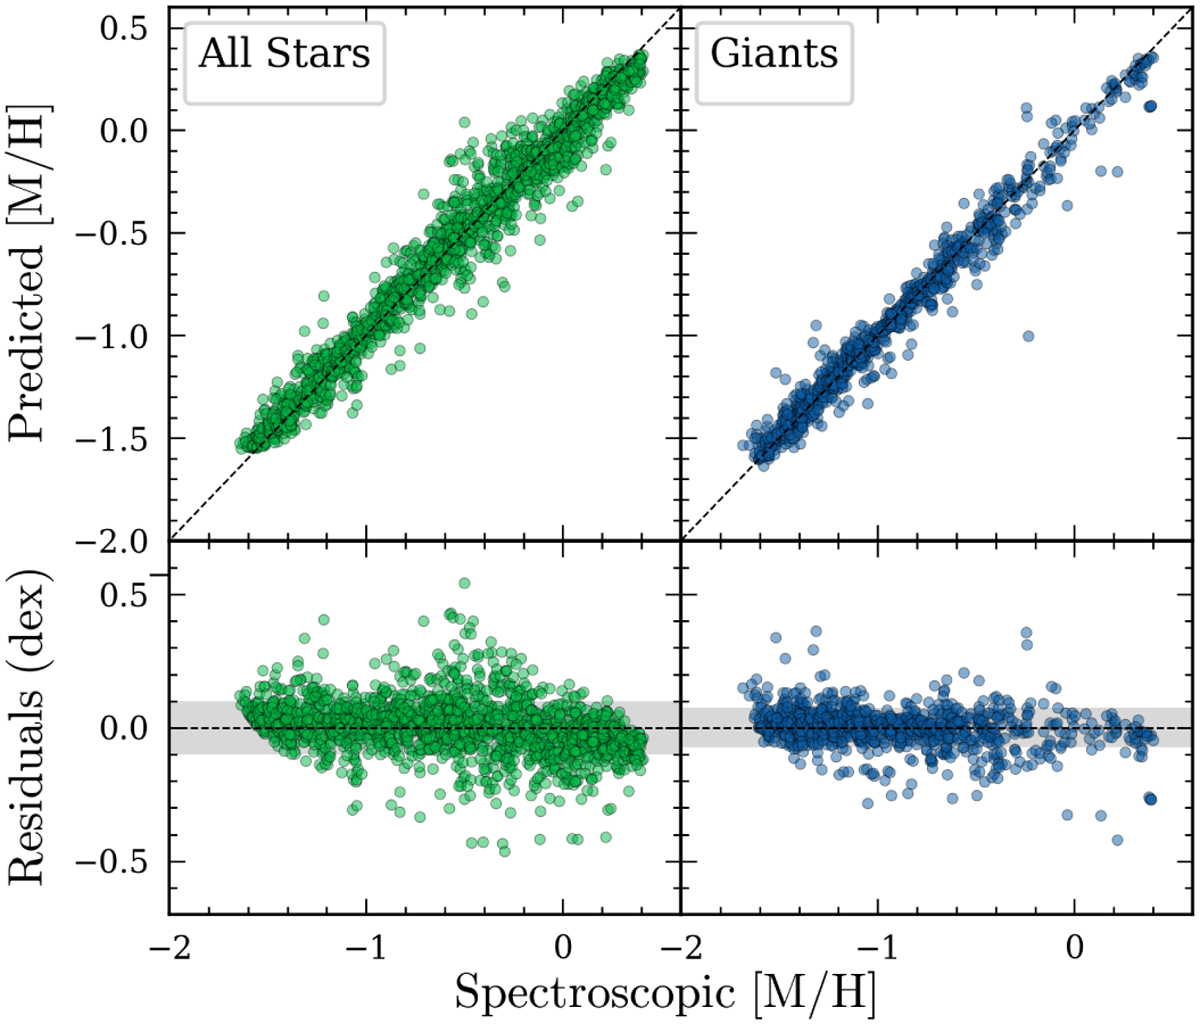
Results of the inference of the ANN-R3292-2 for all stars (left, green) and the ANN-R4290-2 only for giants (right, blue) for the test set. The upper panels show the predictions vs the spectroscopic metallicities, and the lower panels show the residual for the metallicities. The grey area indicates a range of ±1 in standard deviation, which is 0.1 (dex) for all stars and 0.07 (dex) for giants only. The residuals were calculated as the difference between the predictions and the spectroscopic metallicities.
Current usage metrics show cumulative count of Article Views (full-text article views including HTML views, PDF and ePub downloads, according to the available data) and Abstracts Views on Vision4Press platform.
Data correspond to usage on the plateform after 2015. The current usage metrics is available 48-96 hours after online publication and is updated daily on week days.
Initial download of the metrics may take a while.