Fig. 3
Download original image
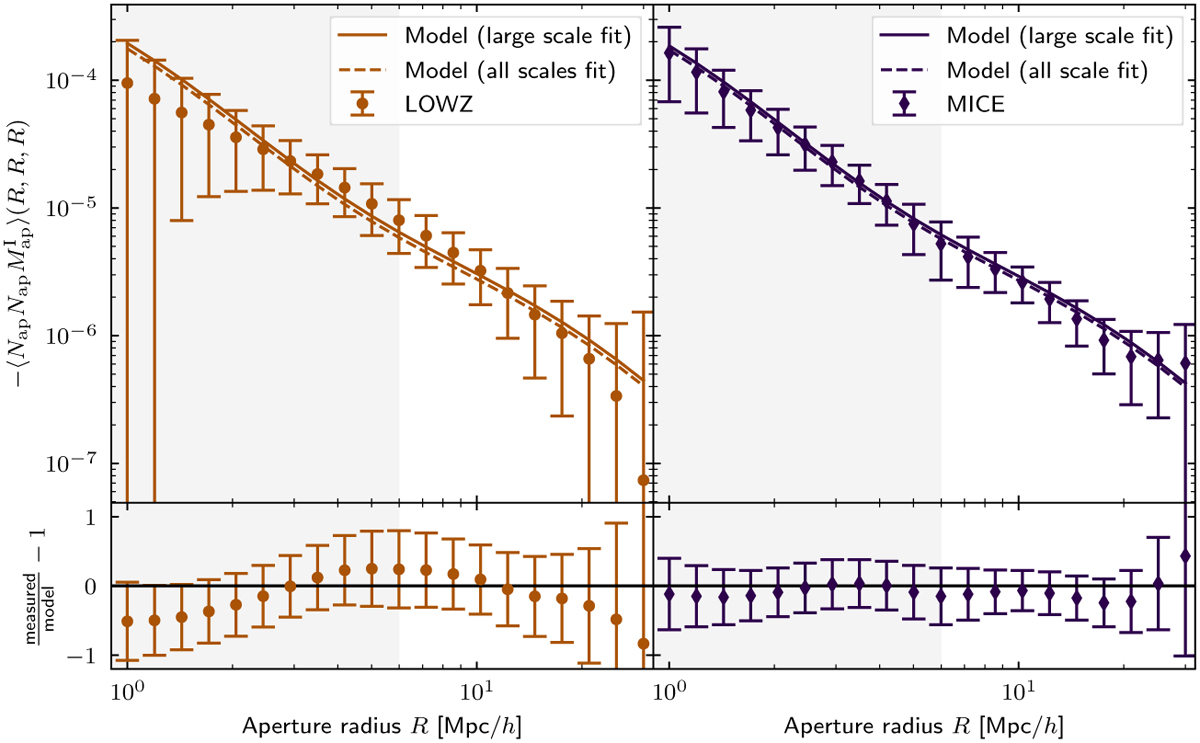
Comparison of IA measurements for full LOWZ and simulated galaxy samples to model fits. Upper panels: IAaperture statistics for full galaxy samples. The left panel shows the measurements for the LOWZ galaxies; the right panel shows measurements for the simulated MICE galaxies. Points are measurements with jackknife error estimates. Solid lines show the model fit using scales above 6 h−1 Mpc; dashed lines are the model fit using all shown scales. Lower panels: relative difference of measurement to model fit for large scales.
Current usage metrics show cumulative count of Article Views (full-text article views including HTML views, PDF and ePub downloads, according to the available data) and Abstracts Views on Vision4Press platform.
Data correspond to usage on the plateform after 2015. The current usage metrics is available 48-96 hours after online publication and is updated daily on week days.
Initial download of the metrics may take a while.