Fig. 9.
Download original image
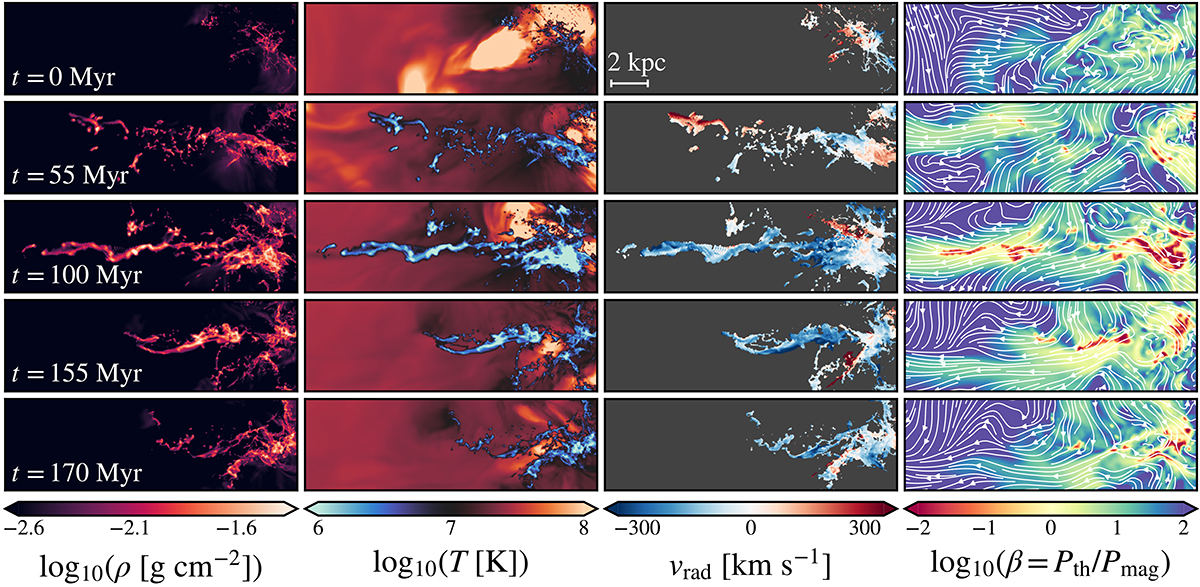
Sequence of images spanning the whole lifetime of filament system #2 (see Sect. 4.2). The panels show, from left to right: the gas column density, density-weighted radial velocity, density of jet scalar, and density-weighted thermal-to-magnetic pressure ratio, β, overlaid with the magnetic field lines. In each case, the plotting region is aligned with the filament’s main axis. The SMBH is located to the right of the plot and the jet axis has an angle of ∼10° with the main filament axis. Time has been re-scaled such that t = 0 coincides with the last snapshot before the first clumps starts to move upwards along the subsequent filament’s main axis. The times of the snapshots have been selected such that the main steps of the filament evolution are most apparent, and are thus voluntarily unevenly spaced.
Current usage metrics show cumulative count of Article Views (full-text article views including HTML views, PDF and ePub downloads, according to the available data) and Abstracts Views on Vision4Press platform.
Data correspond to usage on the plateform after 2015. The current usage metrics is available 48-96 hours after online publication and is updated daily on week days.
Initial download of the metrics may take a while.