Fig. 8.
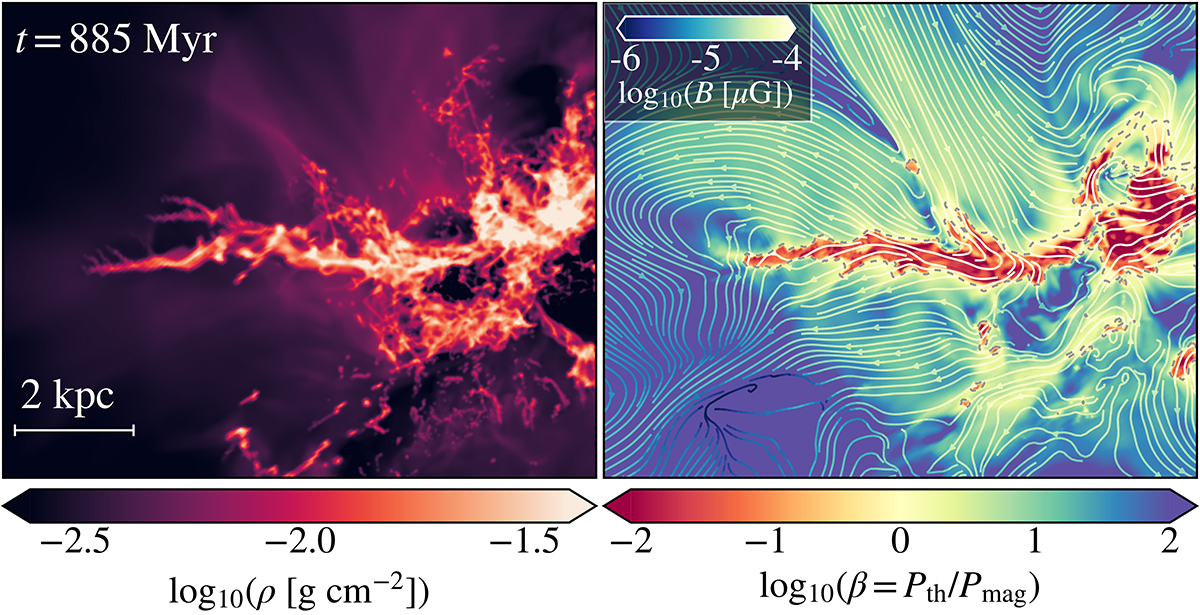
Download original image
Projection of the gas density (left) and slice of the plasma, β, overlaid with the magnetic field lines (right) for the filament #3. The projection depth of the density plot is 4 kpc. The dashed grey line around the filament core represents the contour of equi-partition between magnetic and thermal pressure (movies available online).
Current usage metrics show cumulative count of Article Views (full-text article views including HTML views, PDF and ePub downloads, according to the available data) and Abstracts Views on Vision4Press platform.
Data correspond to usage on the plateform after 2015. The current usage metrics is available 48-96 hours after online publication and is updated daily on week days.
Initial download of the metrics may take a while.