Fig. 3.
Download original image
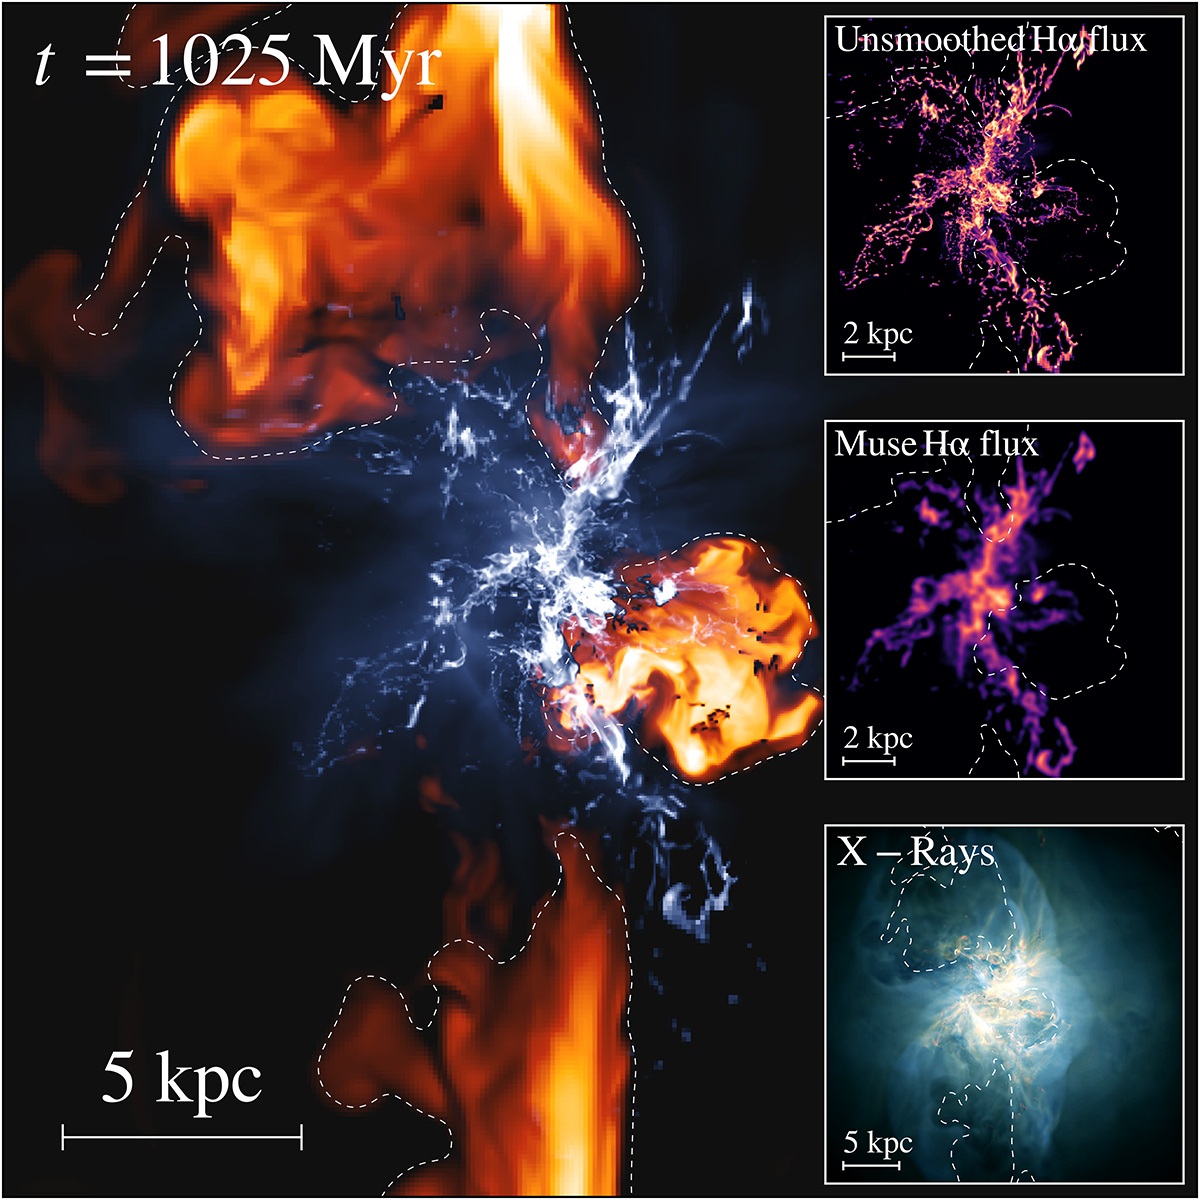
Composite image showing the density-weighted projection of the magnetic field strength (blue) and the temperature (orange) for the inner 25 kpc of our high-resolution MHD run at t = 1025 Myr. Mock Hα and X-ray images are also shown in the lower right of the image. The top Hα image is untouched, while the centre right one has been smoothed with a Gaussian filter to match the angular resolution of the Muse instrument, assuming our cluster is at the same distance as the Perseus cluster, and is comparable to Fig. 2 in Olivares et al. (2019). The X-ray image is a superposition of three filters; namely, the 0.3–1.2 keV (red), 1.2–keV (green), and 2–7 keV (blue) bands, and is comparable to Fig. 1 from Fabian et al. (2006). The dashed white line is a contour map from the temperature field, showing the position of the outflowing bubbles.
Current usage metrics show cumulative count of Article Views (full-text article views including HTML views, PDF and ePub downloads, according to the available data) and Abstracts Views on Vision4Press platform.
Data correspond to usage on the plateform after 2015. The current usage metrics is available 48-96 hours after online publication and is updated daily on week days.
Initial download of the metrics may take a while.