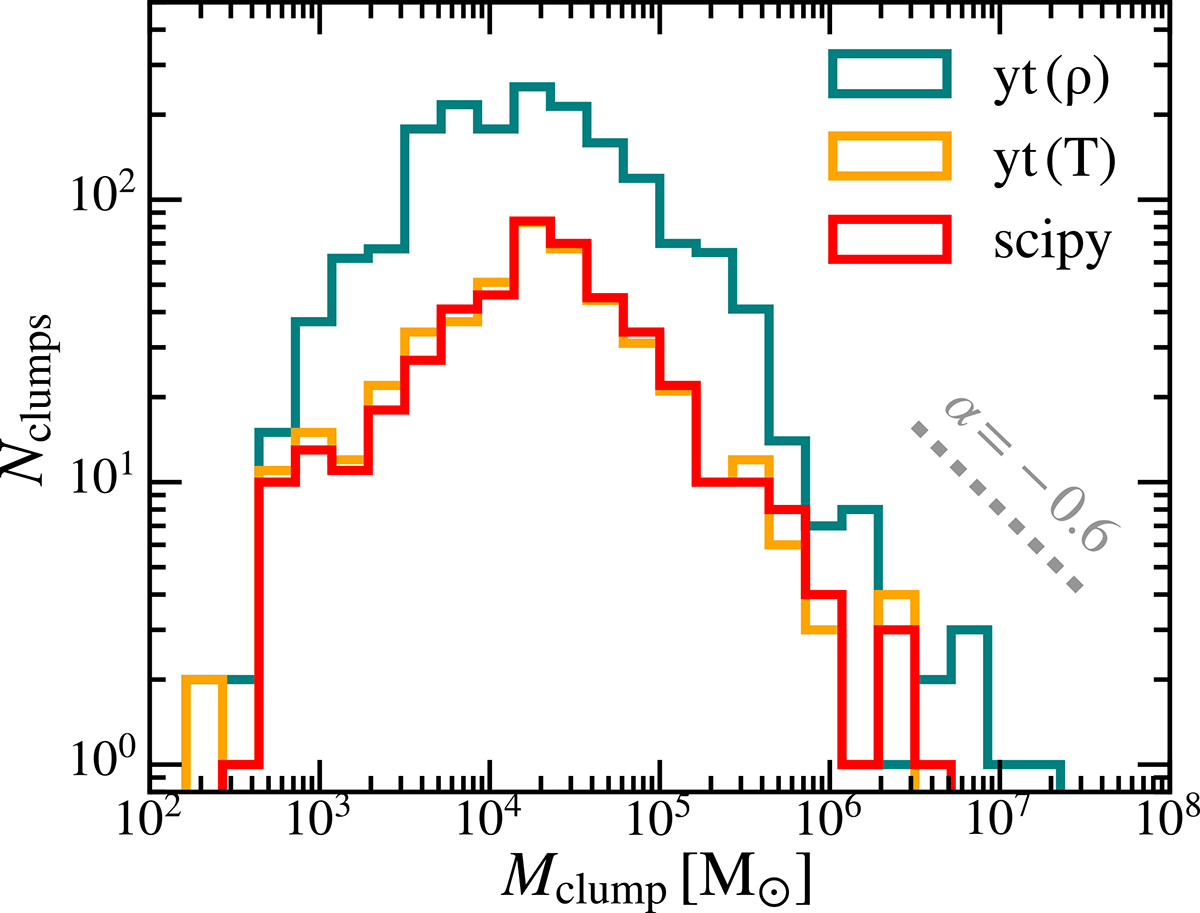
Fig. B.1.
Download original image
Comparison of the clump distribution in the inner 10 kpc of our fiducial MHD simulation at t = 960 Myr with three different method. The blue and orange curves shows the distribution of the clumps with yt (Turk et al. 2011) based on density and temperature criteria. The red curve indicates the clump distribution using Scipy’s ndimage (Virtanen et al. 2020), and is comparable to the method used in (Gronke et al. 2022) and Das & Gronke (2024). The inclination of a power law of slope α ∼ −0.6 is indicated for comparison.
Current usage metrics show cumulative count of Article Views (full-text article views including HTML views, PDF and ePub downloads, according to the available data) and Abstracts Views on Vision4Press platform.
Data correspond to usage on the plateform after 2015. The current usage metrics is available 48-96 hours after online publication and is updated daily on week days.
Initial download of the metrics may take a while.