Fig. 16.
Download original image
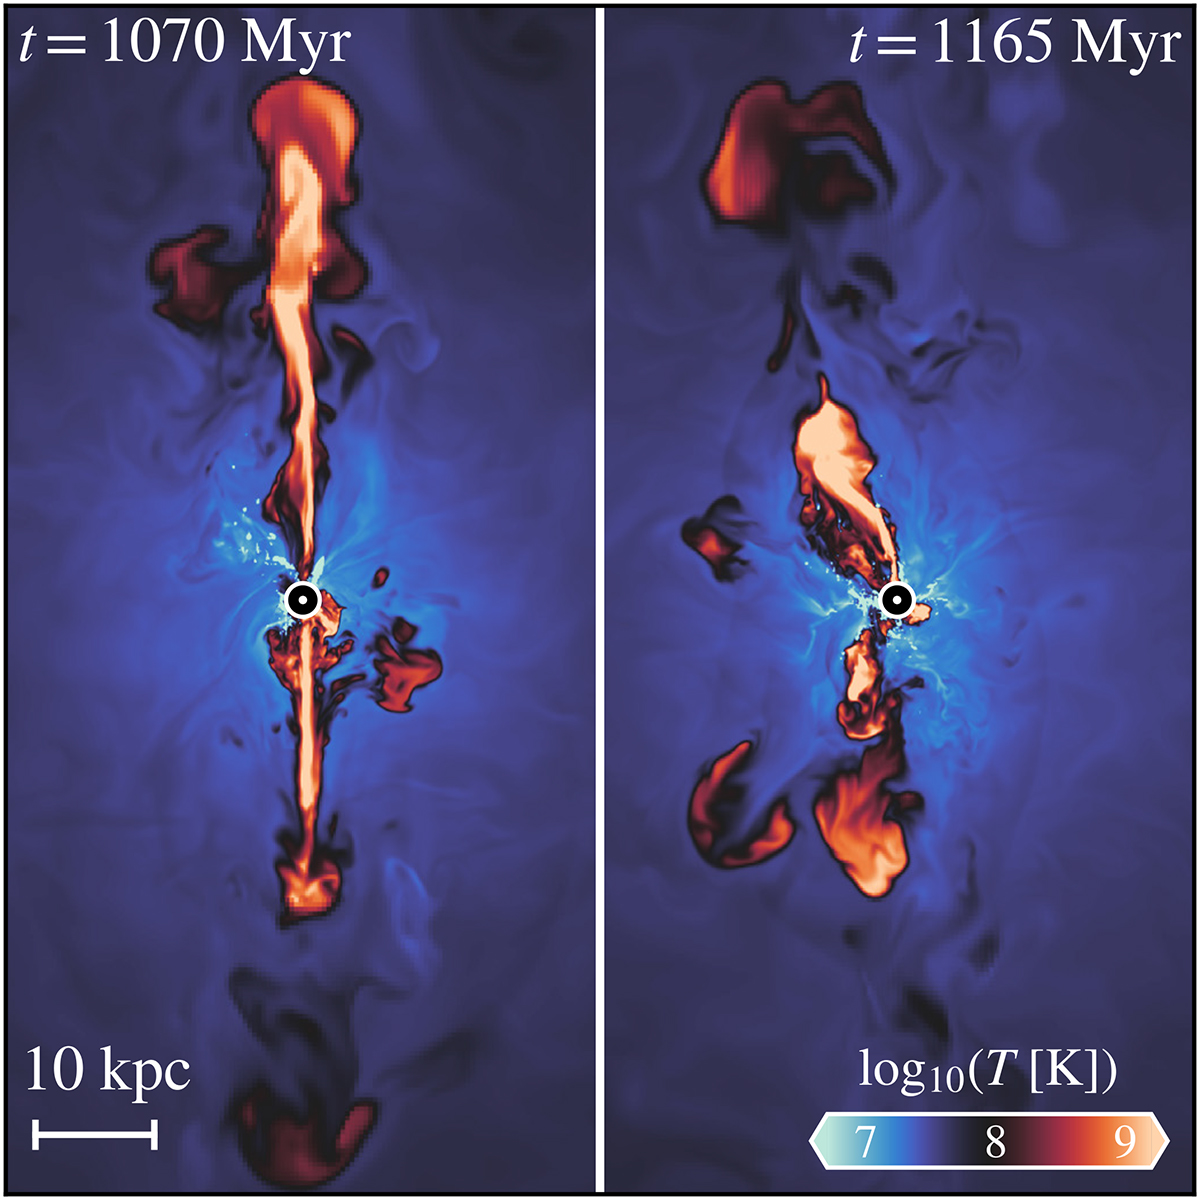
Projection of the temperature field in the mid-plane of the simulation at two different times. The left panel shows a typical example of jets propagating in an unperturbed way, staying collimated up to a distance of 45 kpc. In the right panel, several hot spots resulting from previous AGN bursts can be identified in various directions, as can jet bending. The circular marker represents the position of the SMBH particle, and the jet injection axis is the vertical axis of the image.
Current usage metrics show cumulative count of Article Views (full-text article views including HTML views, PDF and ePub downloads, according to the available data) and Abstracts Views on Vision4Press platform.
Data correspond to usage on the plateform after 2015. The current usage metrics is available 48-96 hours after online publication and is updated daily on week days.
Initial download of the metrics may take a while.