Fig. 12.
Download original image
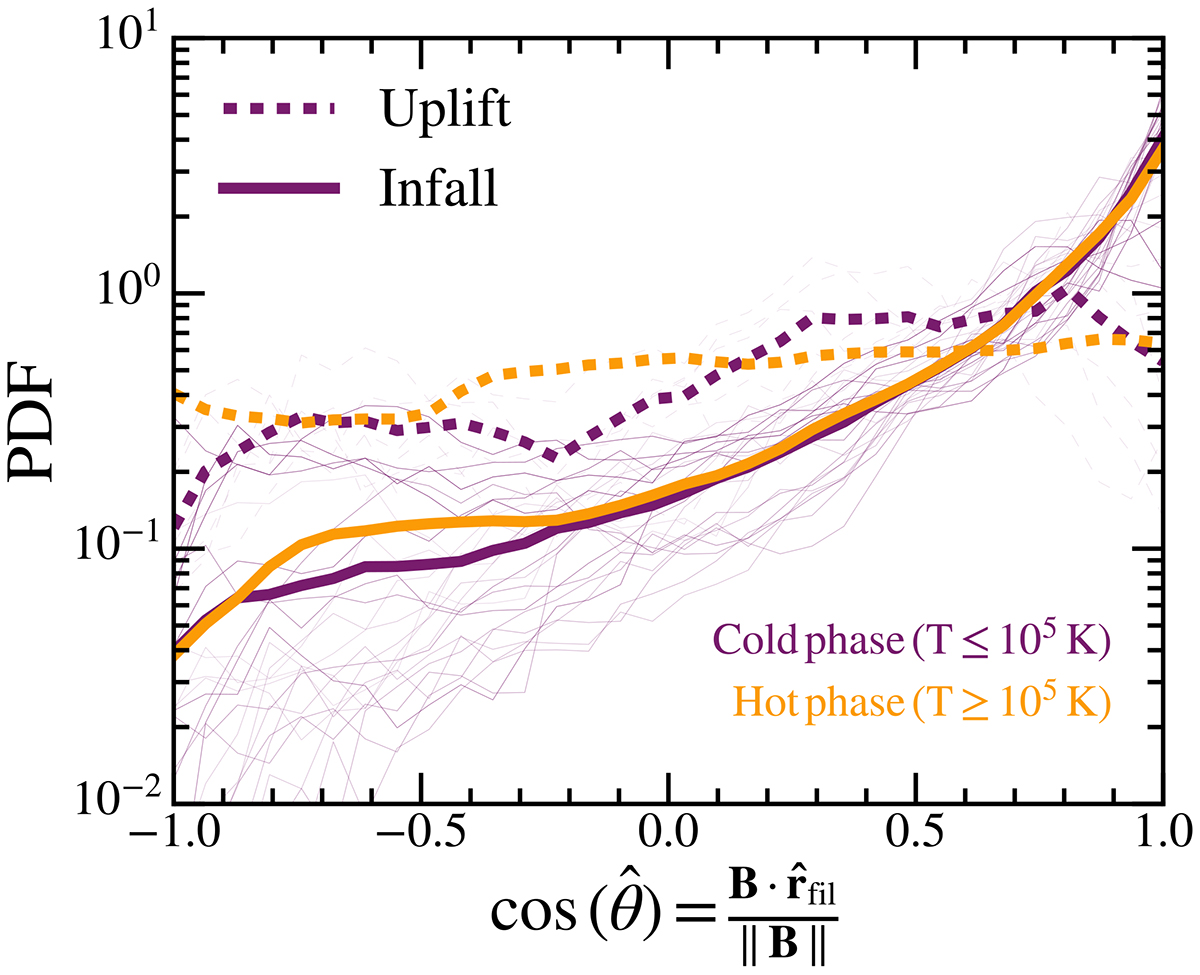
Cell volume-weighted distribution of the angle between the magnetic field, B, and the unit vector, ![]() , for filament #2, with
, for filament #2, with ![]() indicating the main axis of the filament, pointing outwards from the cluster’s centre. The dashed line indicates the distribution averaged over the snapshots corresponding to the phase where the average radial velocity of the filament is positive, while the solid curved is averaged on the subsequent infalling part (see Fig. 11). The thin curves in the background indicate the successive individual curves for the cold phase, with darker colours associated with later times.
indicating the main axis of the filament, pointing outwards from the cluster’s centre. The dashed line indicates the distribution averaged over the snapshots corresponding to the phase where the average radial velocity of the filament is positive, while the solid curved is averaged on the subsequent infalling part (see Fig. 11). The thin curves in the background indicate the successive individual curves for the cold phase, with darker colours associated with later times.
Current usage metrics show cumulative count of Article Views (full-text article views including HTML views, PDF and ePub downloads, according to the available data) and Abstracts Views on Vision4Press platform.
Data correspond to usage on the plateform after 2015. The current usage metrics is available 48-96 hours after online publication and is updated daily on week days.
Initial download of the metrics may take a while.