Open Access
Fig. 1
Download original image
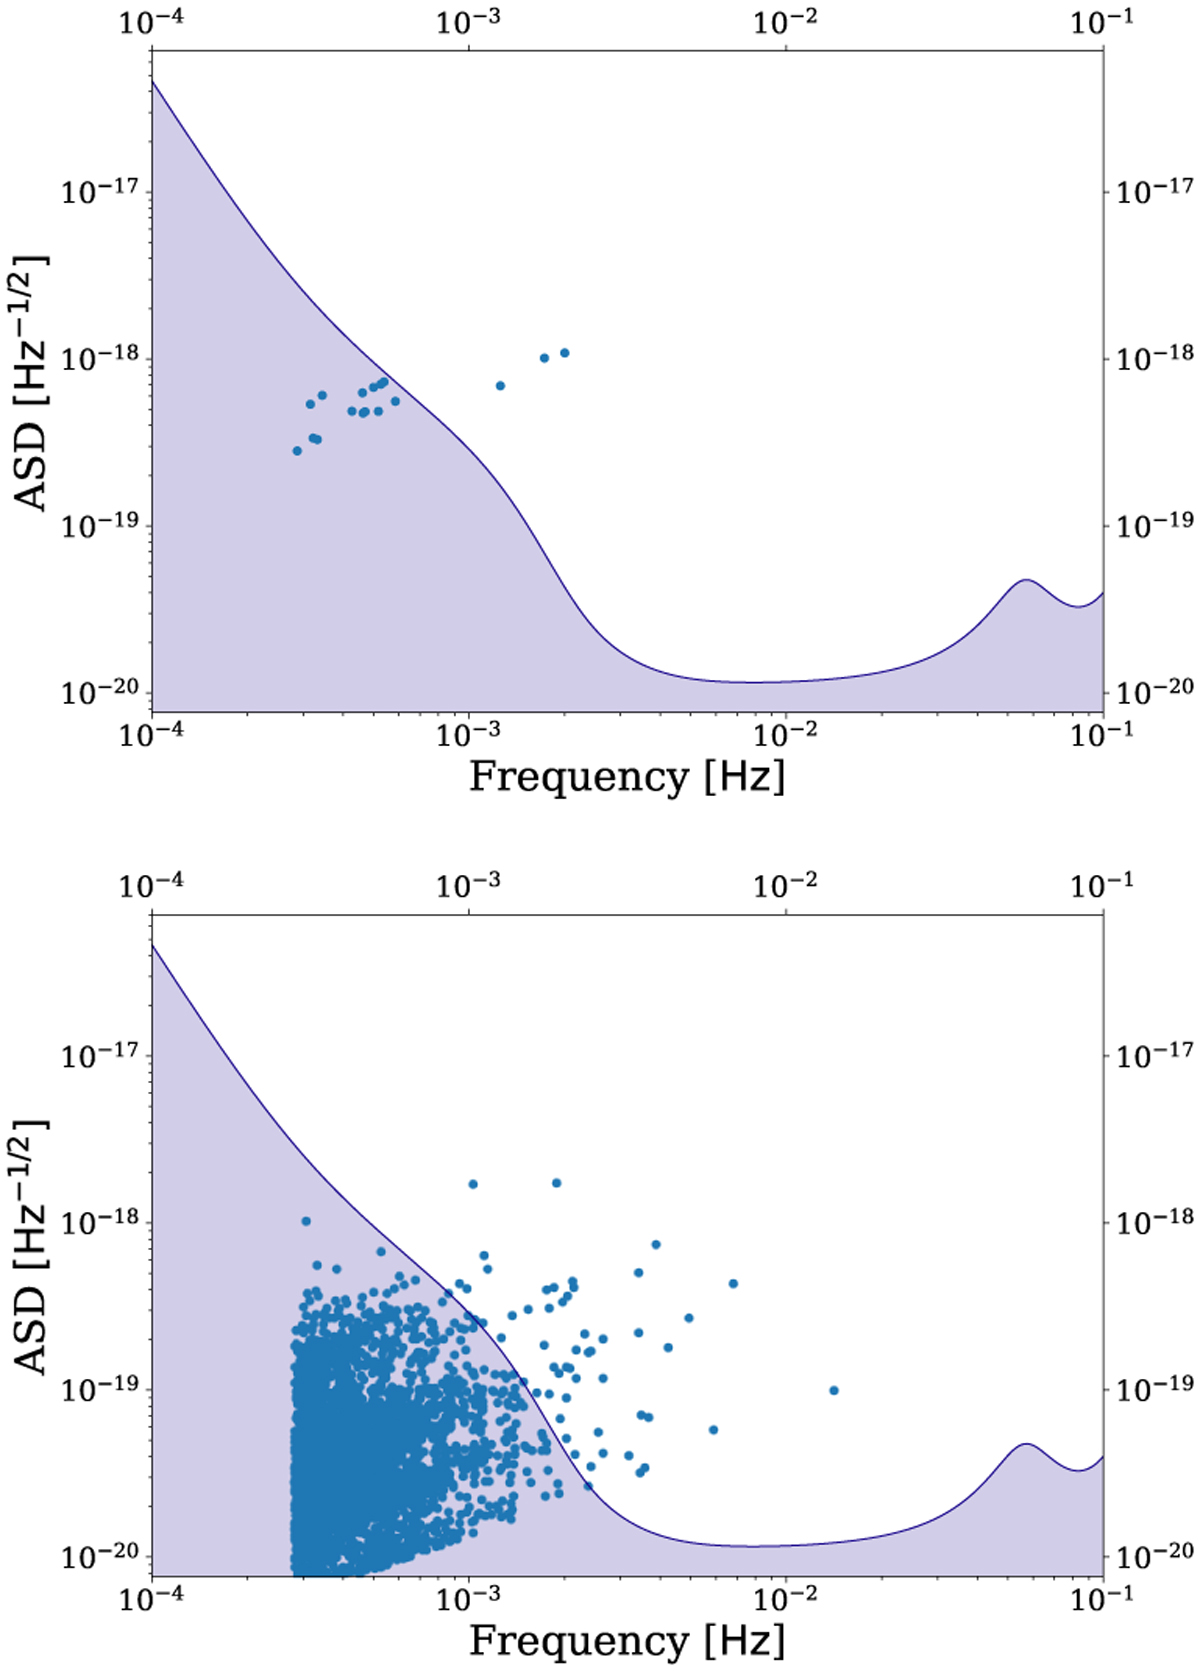
Plots generated using LEGWORK comparing the strain of binaries in two example populations to the LISA sensitivity curve. The first panel is for a population based on Omega Centauri and the second is based on the LMC. Binaries with frequencies below 10−3.6 Hz are not shown.
Current usage metrics show cumulative count of Article Views (full-text article views including HTML views, PDF and ePub downloads, according to the available data) and Abstracts Views on Vision4Press platform.
Data correspond to usage on the plateform after 2015. The current usage metrics is available 48-96 hours after online publication and is updated daily on week days.
Initial download of the metrics may take a while.