Fig. 2.
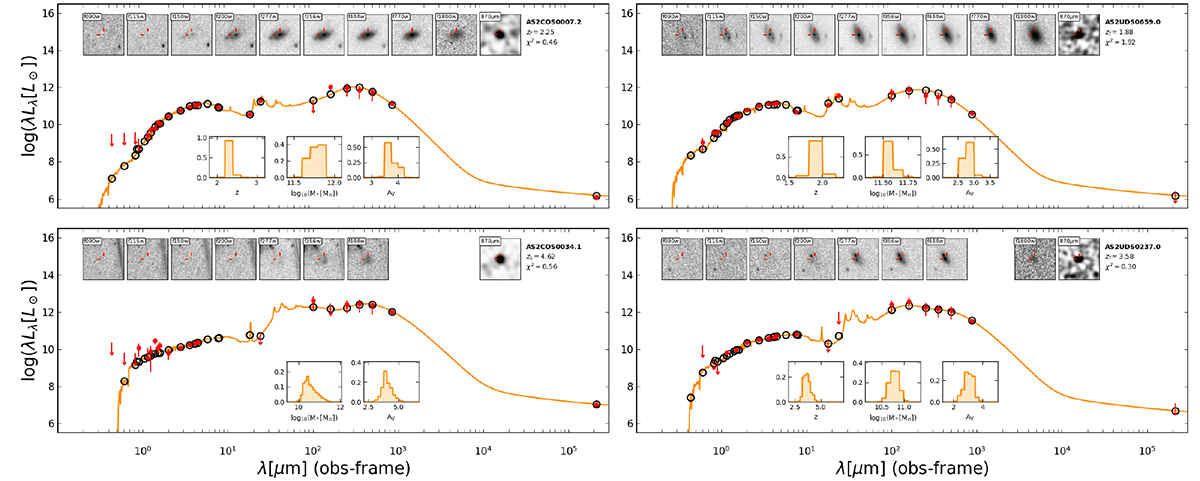
Download original image
Multi-wavelength SEDs for four example SMGs that demonstrate the range of observed-frame infrared colours displayed by the SMG sample. Appendix B shows the SEDS for the full sample. For each source, we indicate the observed flux and error in each band with a red circle and error bar. Arrows show upper limits at 3σ. We over-plot the best-fit magphys derived SED (orange line) and model fluxes (black circles). Below each SED we display the probability distributions of the MAGPHYS derived properties: redshift (unless spectroscopic), stellar mass and AV, and report the best-fit redshift and reduced χ2 from the fit in the top right. Above the SED we display the multi-wavelength JWST and ALMA 870 μm imaging used as part of the analysis, with the SMG centroid indicated by the red tick markers.
Current usage metrics show cumulative count of Article Views (full-text article views including HTML views, PDF and ePub downloads, according to the available data) and Abstracts Views on Vision4Press platform.
Data correspond to usage on the plateform after 2015. The current usage metrics is available 48-96 hours after online publication and is updated daily on week days.
Initial download of the metrics may take a while.