Fig. 10.
Download original image
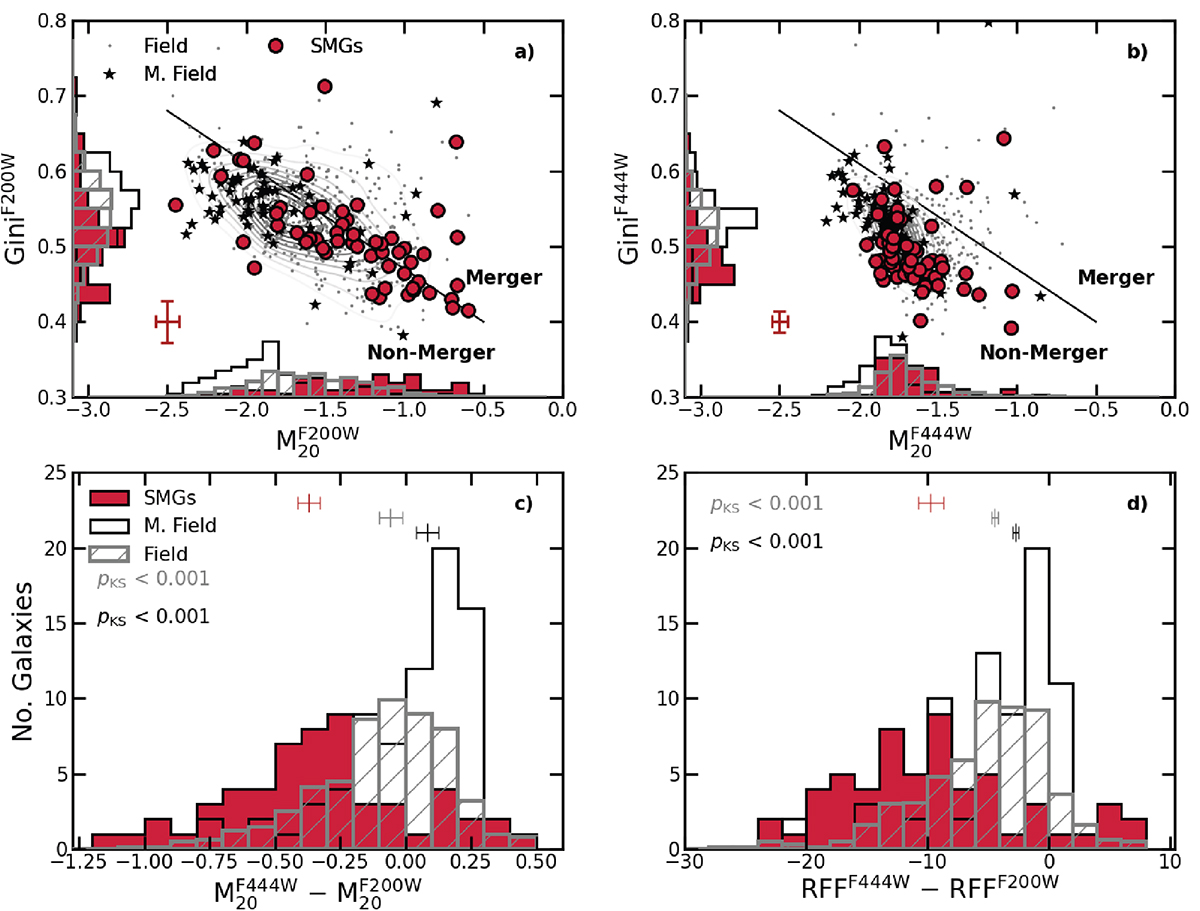
Gini–M20 relation for the less active field galaxies (grey dots and contours), massive field galaxies (black stars) and SMG sample (red circles), in the a) F200W and b) F444W bands as well as histograms showing the distribution of each parameter on each axis, with the low-mass field scaled down by a factor 10. The solid black line indicates the boundary line between mergers and non-mergers as defined in Lotz et al. (2008). Both SMGs and field galaxies scatter about the line in the F200W band whilst the majority lie in the non-merger region of the equivalent F444W plot. In panels c) and d) we show the distributions of ![]() −
− ![]() and RFFF444W − RFFF200W. For each distribution, we indicate the KS-statistic showing that the SMGs have a stronger variation in morphology with wavelength with higher RFF and M20 values at 2 μm than 4 μm indicating more structure in the residuals and disturbed morphologies.
and RFFF444W − RFFF200W. For each distribution, we indicate the KS-statistic showing that the SMGs have a stronger variation in morphology with wavelength with higher RFF and M20 values at 2 μm than 4 μm indicating more structure in the residuals and disturbed morphologies.
Current usage metrics show cumulative count of Article Views (full-text article views including HTML views, PDF and ePub downloads, according to the available data) and Abstracts Views on Vision4Press platform.
Data correspond to usage on the plateform after 2015. The current usage metrics is available 48-96 hours after online publication and is updated daily on week days.
Initial download of the metrics may take a while.