Fig. 9
Download original image
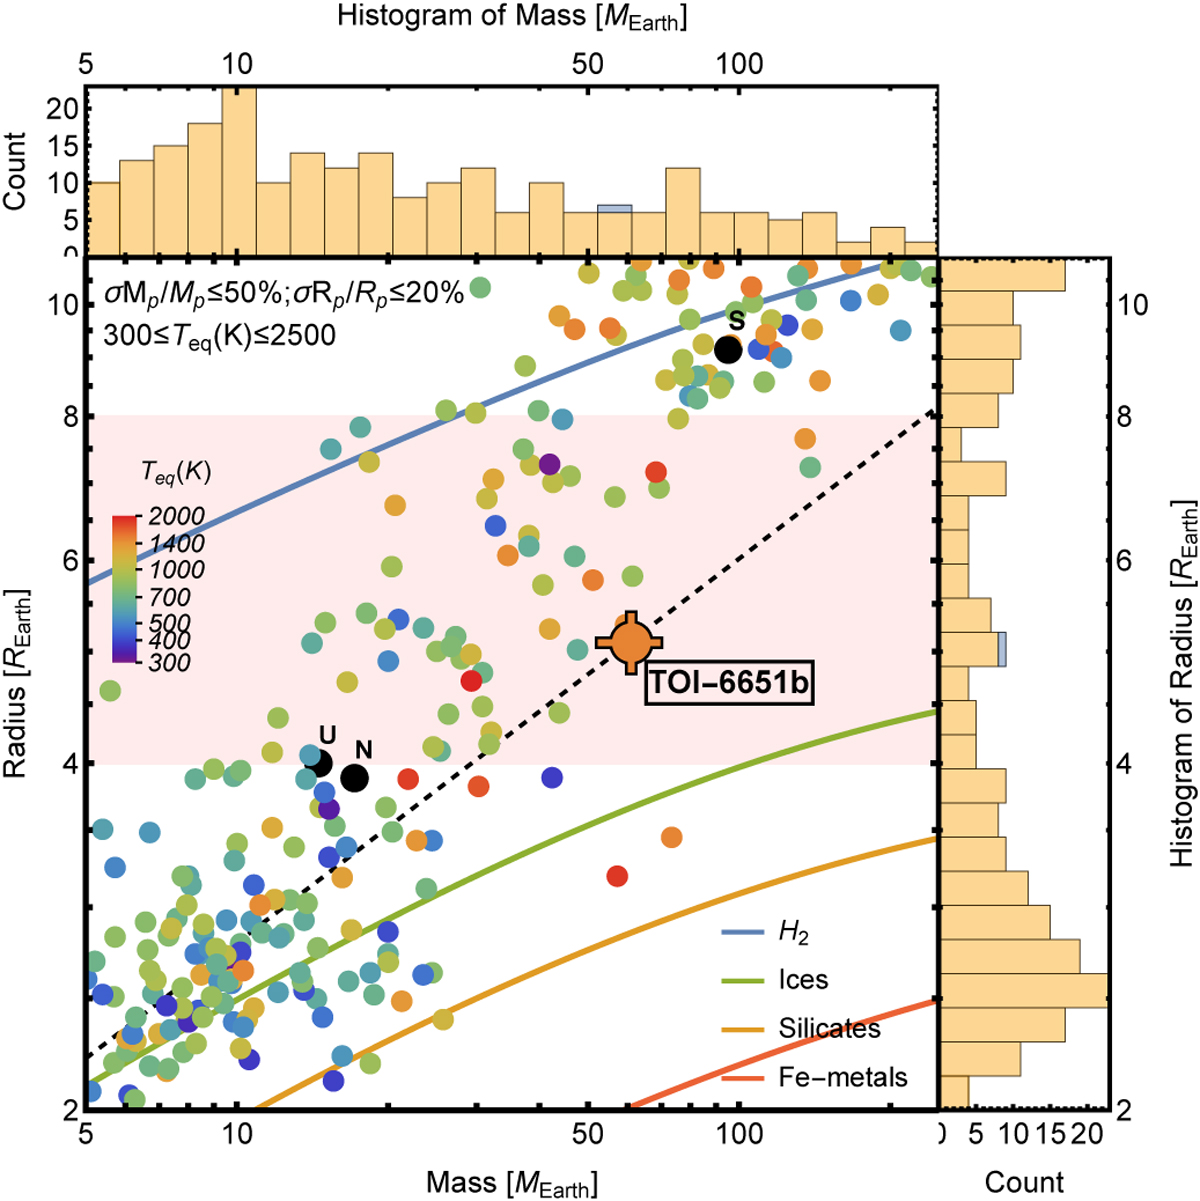
Planetary radius vs. mass of known exoplanets, with histograms in the right and top panels depicting the distribution of radii and masses, respectively. The sample is from the TepCat database (Southworth 2011) and includes exoplanets with mass and radius constraints better than 50 and 20%, respectively, and equilibrium temperatures of planets (Teq) between 300 and 2500 K. The light pink highlighted region represents the sub-Saturn classification, while the black dashed line represents the iso-density curve for ρP = 2.52. The red, orange, green, and blue solid curves represent the M-R diagram for pure-iron, pure-rock, pure high-pressure ices (Zeng et al. 2021) and pure H2 core composition (Becker et al. 2014), respectively. The Solar system planets are represented as black dots. TOI-6651b is positioned above the pure ice composition, indicating the presence of a significant fraction of a H/He envelope.
Current usage metrics show cumulative count of Article Views (full-text article views including HTML views, PDF and ePub downloads, according to the available data) and Abstracts Views on Vision4Press platform.
Data correspond to usage on the plateform after 2015. The current usage metrics is available 48-96 hours after online publication and is updated daily on week days.
Initial download of the metrics may take a while.