Fig. 4
Download original image
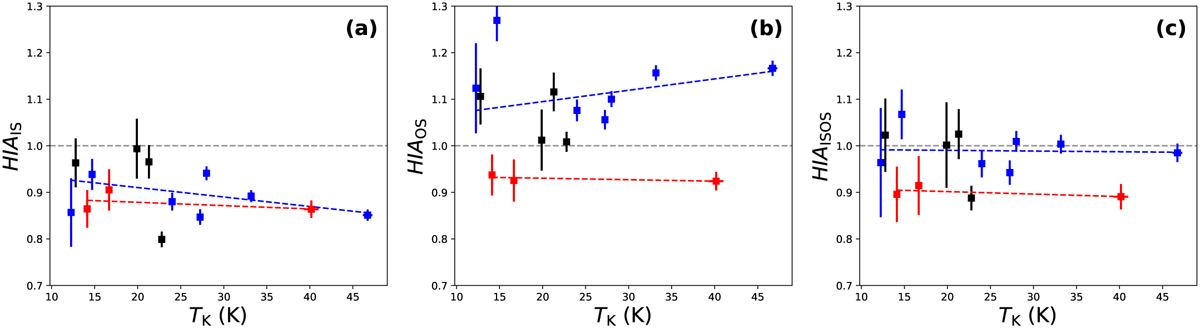
Correlations of HIAIS and TK (panel a), HIAOS and TK (panel b), and HIAISOS and TK (panel c). The HIAs consistent with the HST model and CE model (infall motions) are emphasized in blue and red colors, respectively. Blue and red lines indicate their linear regression results. Linear fit parameters for the blue and red lines are given in Table 2.
Current usage metrics show cumulative count of Article Views (full-text article views including HTML views, PDF and ePub downloads, according to the available data) and Abstracts Views on Vision4Press platform.
Data correspond to usage on the plateform after 2015. The current usage metrics is available 48-96 hours after online publication and is updated daily on week days.
Initial download of the metrics may take a while.