Fig. 2
Download original image
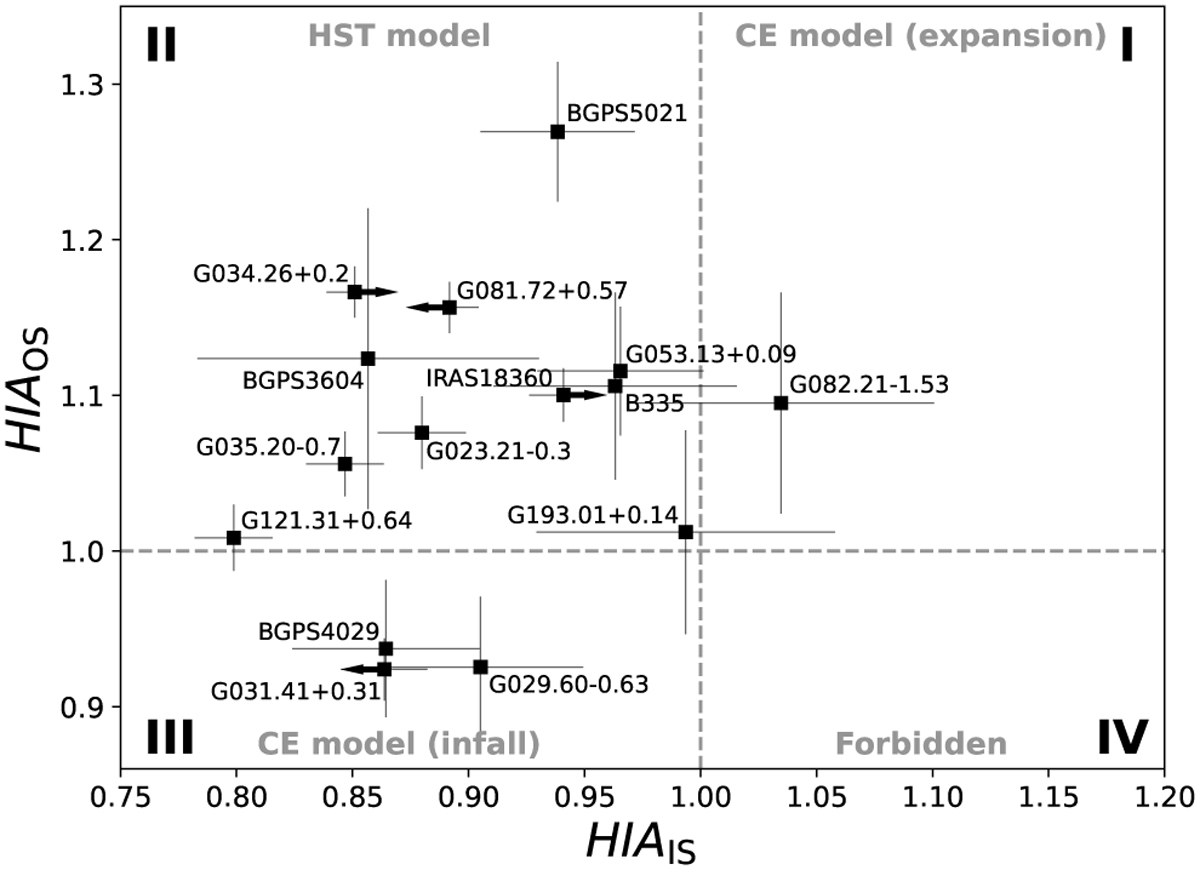
Distribution of the hyperfine intensity anomalies of the inner (HIAIS) and outer (HIAOS) satellite lines. Arrows indicate potential corrections for the blending of the primary and inner satellite lines. The source name is marked in close proximity to each data point. Gray dashed vertical and horizontal lines divide the panel into four subregions: I for HIAIS > 1 and HIAOS > 1, II for HIAIS < 1 and HIAOS > 1, III for HIAIS < 1 and HIAOS < 1, and IV for HIAIS > 1 and HIAOS < 1. The models that cause HIAs to be located in these subregions are also labeled.
Current usage metrics show cumulative count of Article Views (full-text article views including HTML views, PDF and ePub downloads, according to the available data) and Abstracts Views on Vision4Press platform.
Data correspond to usage on the plateform after 2015. The current usage metrics is available 48-96 hours after online publication and is updated daily on week days.
Initial download of the metrics may take a while.