Fig. 1
Download original image
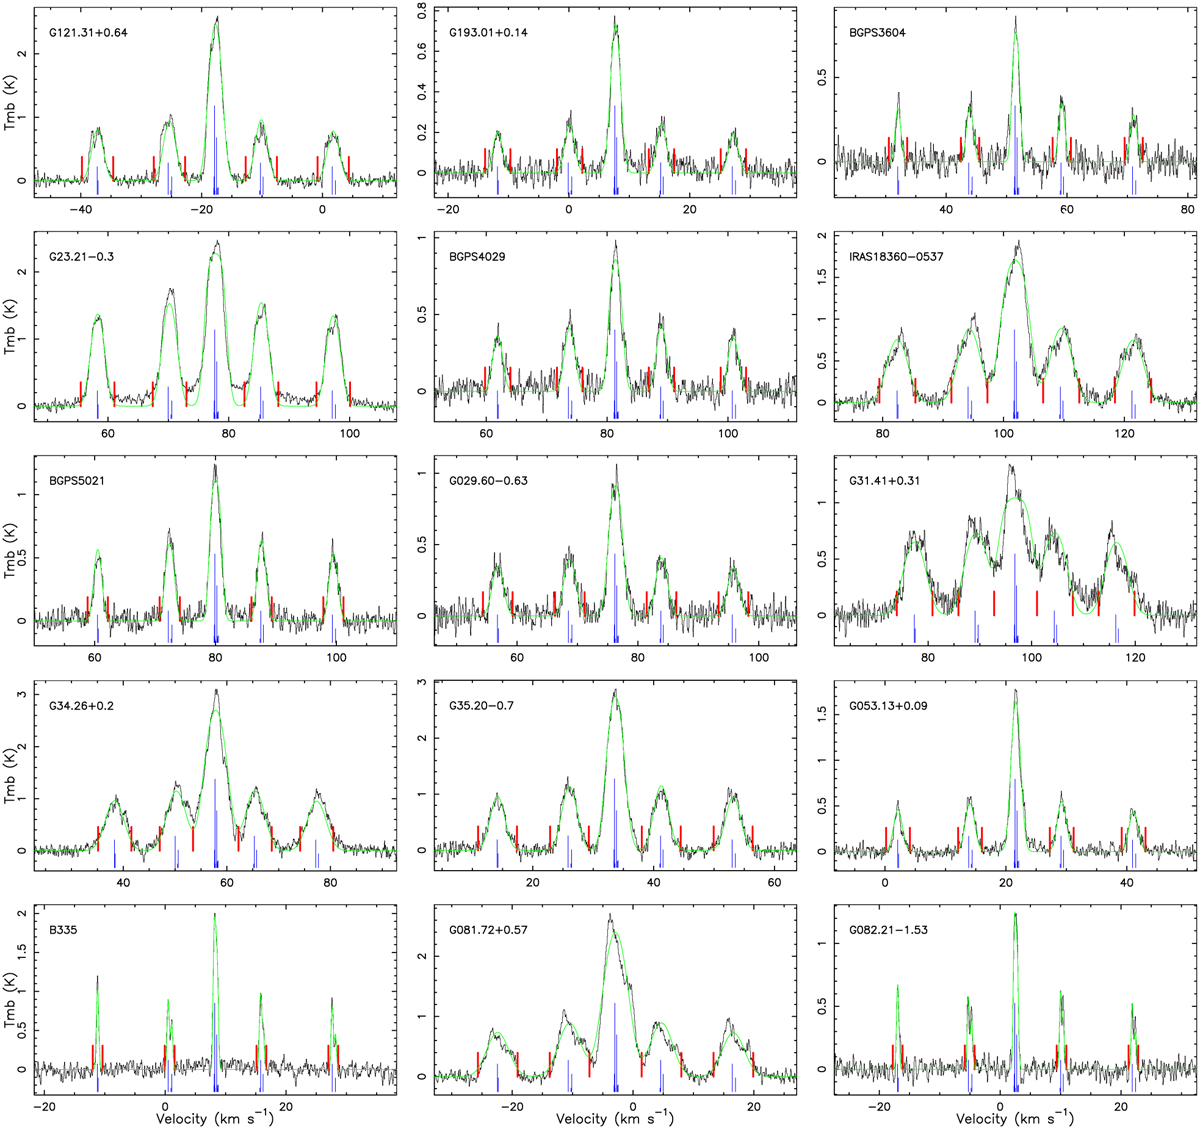
Observed NH3 (J, K) = (1, 1) spectra. In each panel, the green curve represents the fit to 18 hyperfine lines and the blue vertical lines under the spectrum indicate the positions of the 18 hyperfine lines and their relative strengths in the optically thin case under conditions of LTE. The red lines denote the integrated ranges used to calculate the HIA. The source name is labeled in the top-left corner of each panel.
Current usage metrics show cumulative count of Article Views (full-text article views including HTML views, PDF and ePub downloads, according to the available data) and Abstracts Views on Vision4Press platform.
Data correspond to usage on the plateform after 2015. The current usage metrics is available 48-96 hours after online publication and is updated daily on week days.
Initial download of the metrics may take a while.