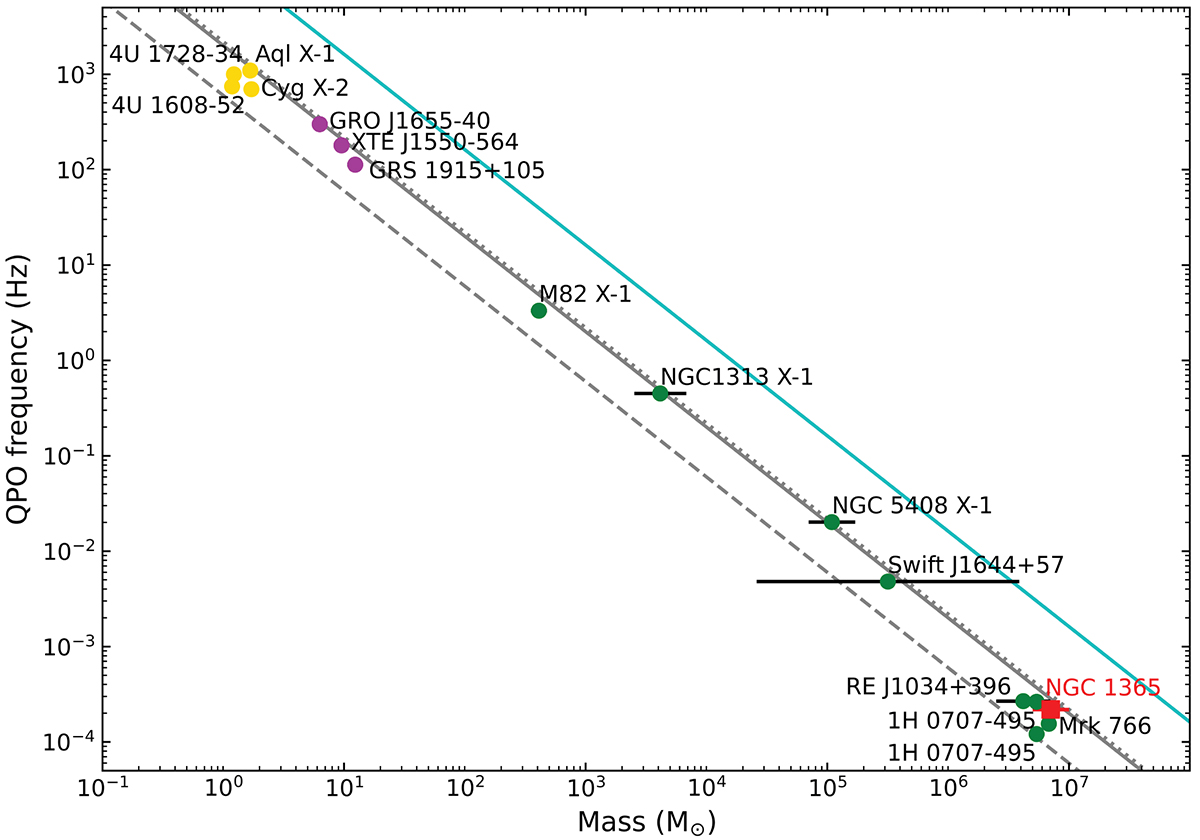
Fig. 5.
Download original image
Correlation between source mass and QPO frequency. The yellow points in the upper left corner represent HF QPO events observed in neutron stars, while the purple points correspond to HF QPO events in Galactic microquasar BHs. The remaining points denote HF QPO events reported in supermassive BHs. The newly detected QPO signal in NGC 1365 is marked with a red square. The three gray lines represent the relationships suggested by Remillard & McClintock (2006) and Kluzniak & Abramowicz (2002). The blue line is based on the maximum allowed orbital frequency proposed by Šrámková et al. (2021), indicating that QPO signals with frequencies above the innermost stable circular orbit would not exist in the region above and to the right of this line. For further information, please refer to the studies by Zhou et al. (2010, 2015) and Zhang et al. (2017, 2018).
Current usage metrics show cumulative count of Article Views (full-text article views including HTML views, PDF and ePub downloads, according to the available data) and Abstracts Views on Vision4Press platform.
Data correspond to usage on the plateform after 2015. The current usage metrics is available 48-96 hours after online publication and is updated daily on week days.
Initial download of the metrics may take a while.