Fig. 1.
Download original image
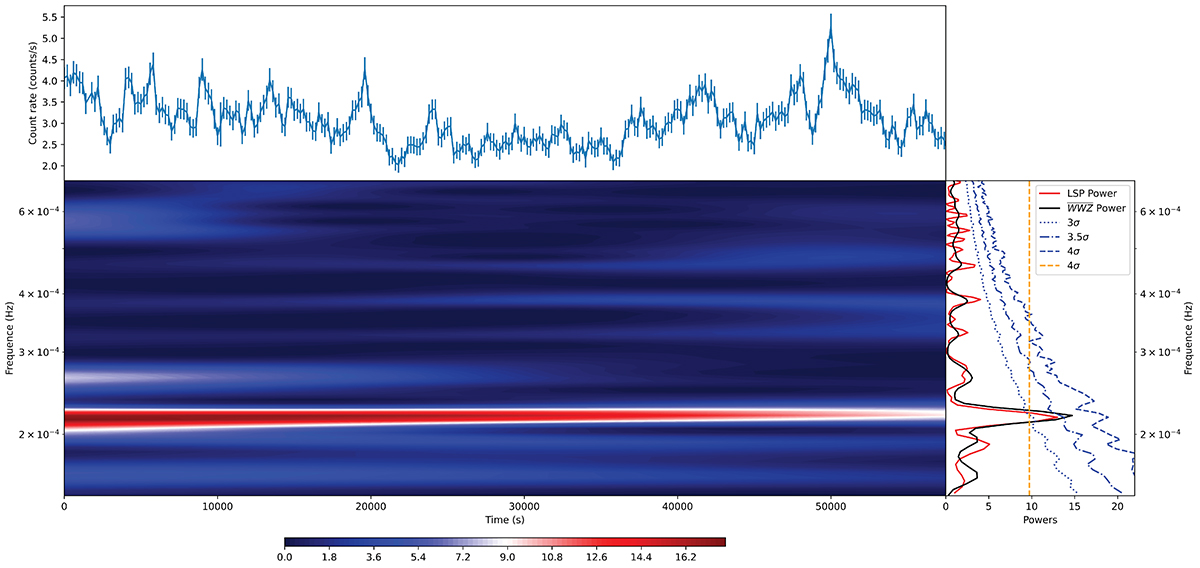
Light curve and WWZ power of EPIC camera of the XMM-Newton ObsID 0205590301. The upper panel shows the light curve in the range of 0.2–10.0 keV. The upper panel shows the light curve of the EPIC camera of the ObsID 0205590301 in the range of 0.2–10.0 keV. The lower-left panel displays a two-dimensional plot of dynamic WWZ power in time–frequency space. The lower-right panel displays average WWZ power (black) and LSP value (red) curves. The blue lines represent the confidence levels of 3.0, 3.5, and 4.0 σ, respectively. The orange dotted line represents the 4.0 σ confidence level calculated using the method proposed by Baluev (2008).
Current usage metrics show cumulative count of Article Views (full-text article views including HTML views, PDF and ePub downloads, according to the available data) and Abstracts Views on Vision4Press platform.
Data correspond to usage on the plateform after 2015. The current usage metrics is available 48-96 hours after online publication and is updated daily on week days.
Initial download of the metrics may take a while.