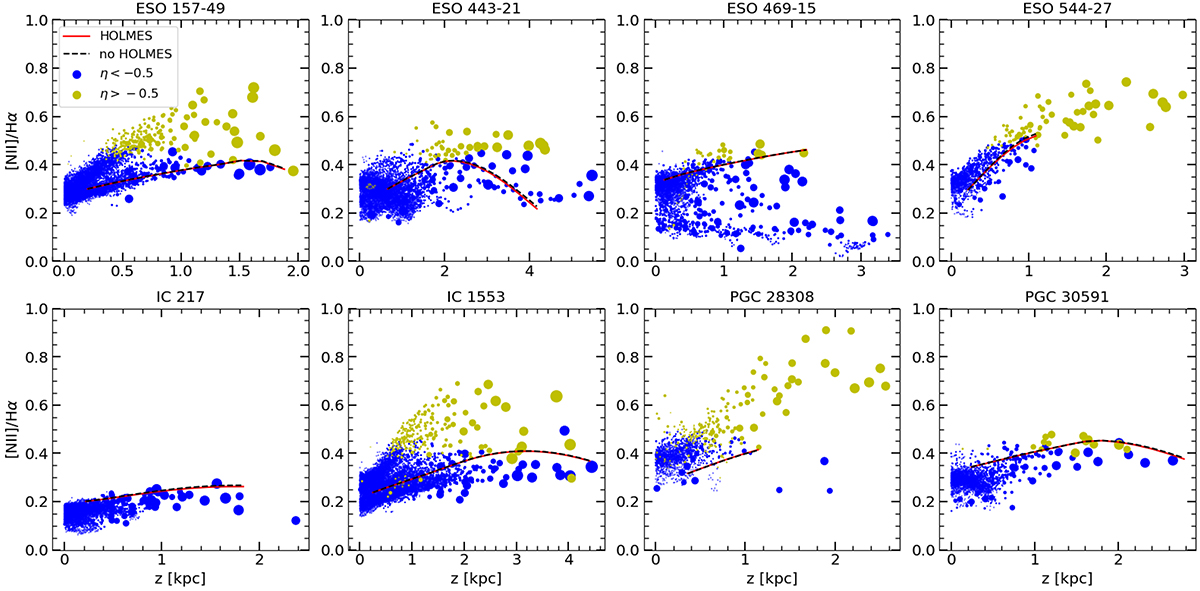
Fig. 5.
Download original image
[N II]/Hα vertical profiles for our sample galaxies. The blue dots show observed values from Voronoi bins with OB star dominated ionization (η < −0.5). The yellow dots show observed values from Voronoi bins with mixed ionization or ionization dominated by other sources (η > −0.5). The size of each dot is relative to the size of the corresponding Voronoi bin. The solid red curve shows our model for the galaxy in question. The dashed black curve is the same model as the red curve but with HOLMES turned off. The contribution from HOLMES to the ionizing radiation is insignificant for our models when fitting OB star dominated ionization.
Current usage metrics show cumulative count of Article Views (full-text article views including HTML views, PDF and ePub downloads, according to the available data) and Abstracts Views on Vision4Press platform.
Data correspond to usage on the plateform after 2015. The current usage metrics is available 48-96 hours after online publication and is updated daily on week days.
Initial download of the metrics may take a while.