Fig. 4.

Download original image
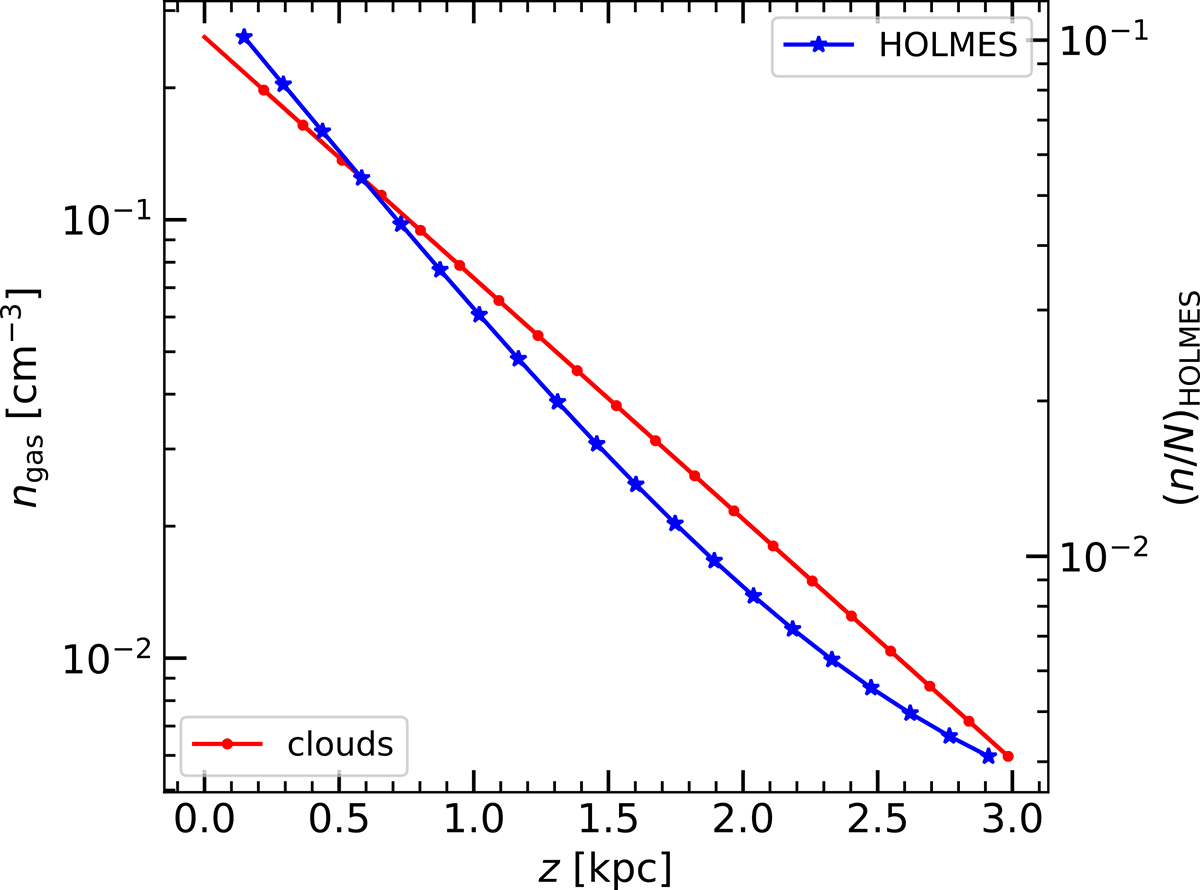
Density profile of gas and HOLMES for an ESO 544−27 model. Red dots indicate the cloud layers and blue stars indicate the HOLMES layers. The connecting solid curves plot the densities. For HOLMES, the relative number density defined as the fraction of HOLMES at each layer is plotted. The model parameters are log U1 = −3.01, which is used to determine the density at midplane (see text), and the scale heights of the gas density (hzn = 0.79 kpc), and HOLMES number density (hzT = 0.67 kpc). The gas density of the clouds follows an exponential profile, while the HOLMES number density profile has an exponential component and a constant component with 10% of the mass of the exponential component ((n/N)HOLMES = 2.5 × 10³).
Current usage metrics show cumulative count of Article Views (full-text article views including HTML views, PDF and ePub downloads, according to the available data) and Abstracts Views on Vision4Press platform.
Data correspond to usage on the plateform after 2015. The current usage metrics is available 48-96 hours after online publication and is updated daily on week days.
Initial download of the metrics may take a while.


