Fig. A.2.
Download original image
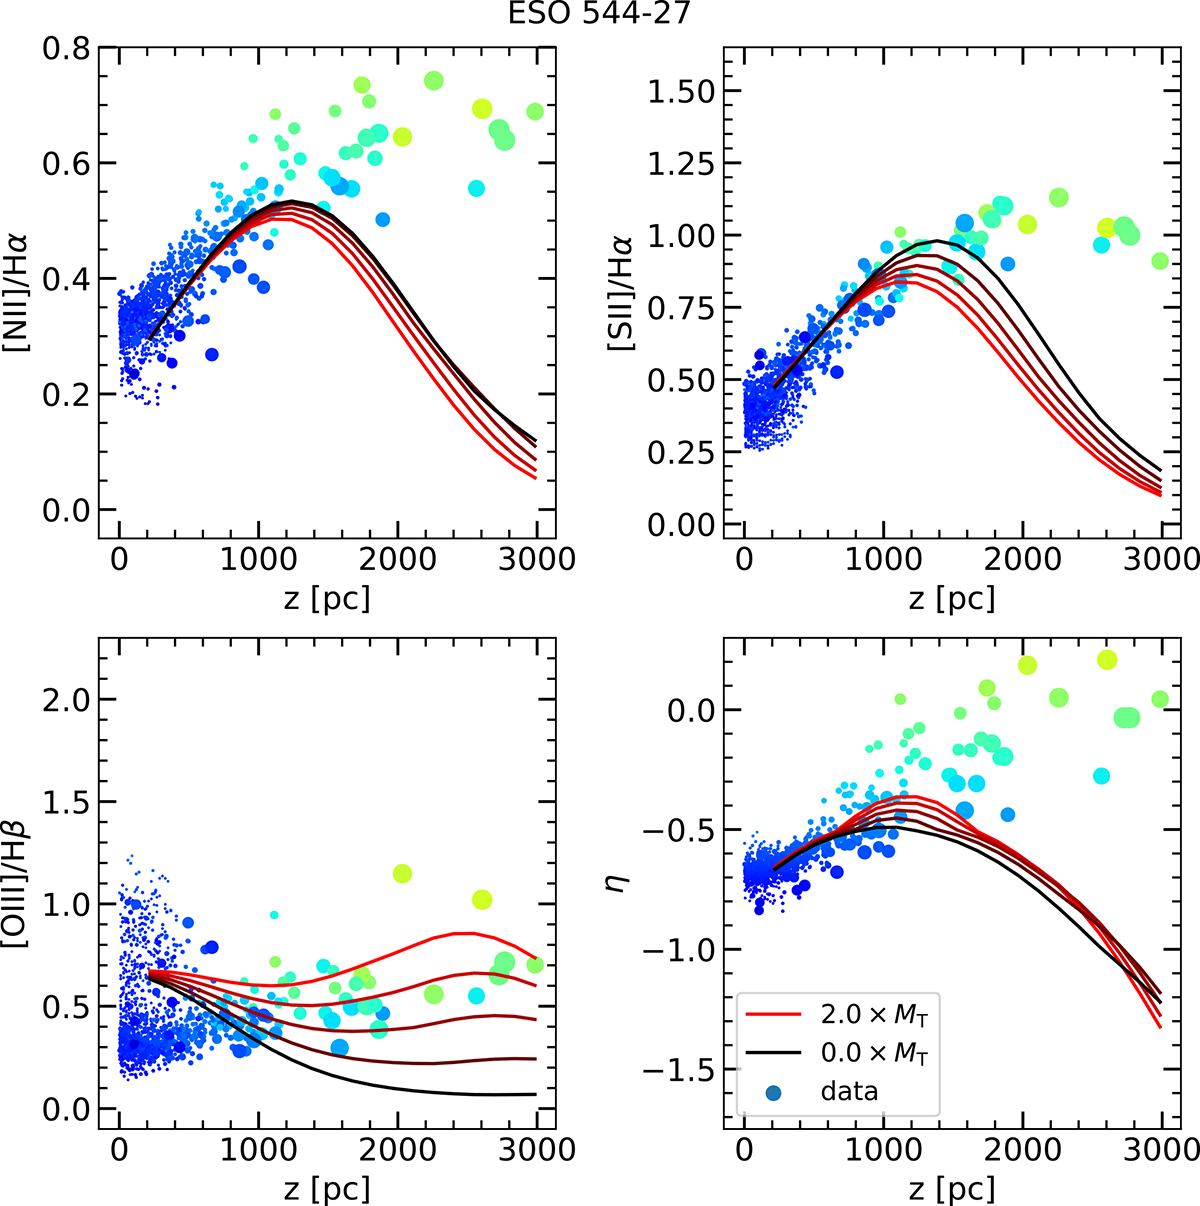
Line ratio and η-parameter profiles for ESO 544-27 models with varying HOLMES mass. The dots show the observed values, colored according to the η-parameter going from blue at low η to green at high η. The size of each dot is relative to the size of the corresponding Voronoi bin. The curves show the model predictions with the color of the curve corresponding with the model MT, ranging from 0.0 × MT. (black) to 2.0 × MT (red) with 0.5MT steps.
Current usage metrics show cumulative count of Article Views (full-text article views including HTML views, PDF and ePub downloads, according to the available data) and Abstracts Views on Vision4Press platform.
Data correspond to usage on the plateform after 2015. The current usage metrics is available 48-96 hours after online publication and is updated daily on week days.
Initial download of the metrics may take a while.