Fig. 15.
Download original image
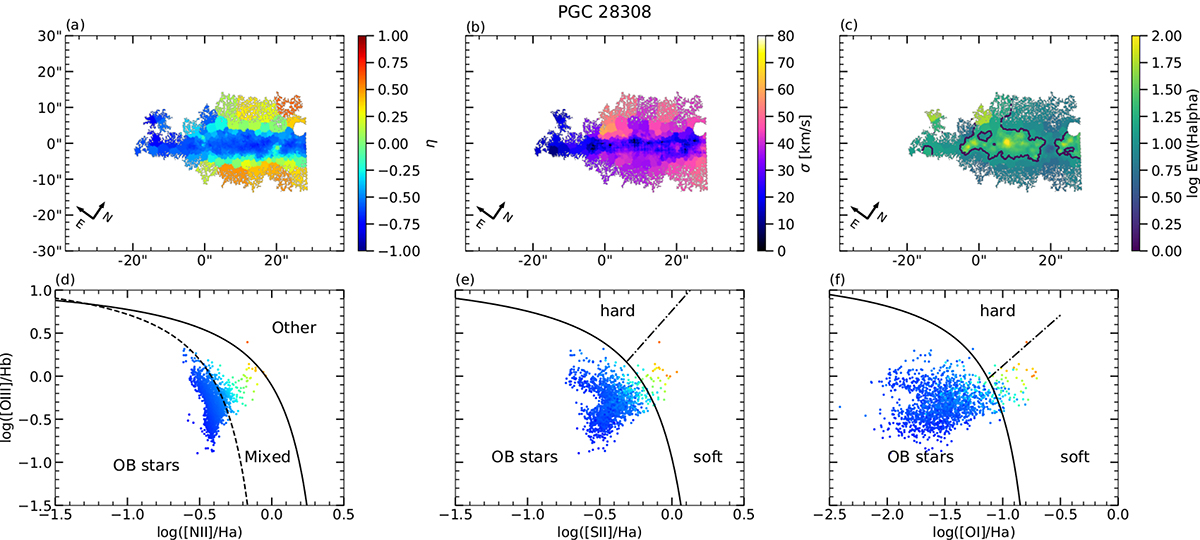
Emission-line properties for PGC 28308. (a): η-parameter map. (b): velocity dispersion map. (c): logarithmic EW(Hα) map. The lower limit of the OB-star-dominated ionization (EW(Hα) = 14 Å) is contoured in black. (d)–(f): VO diagrams. The solid line is the Kewley et al. (2001) extreme starburst line, the dashed line in (d) is the Kauffmann et al. (2003) empirical starburst line, and the dash-dot lines in (e) and (f) are the Kewley et al. (2006) Seyfert and low-ionization narrow emission-line region (LINER) demarcation line. The colors in the VO diagrams correspond to the colors in the η-parameter map. While there is no clear biconical morphology in the η-parameter map, the concentration of the eDIG over the center of the galaxy could hint at ionization by outflow driven shocks. Similar figures for ESO 443−21 and PGC 28308 are found in Appendix B.
Current usage metrics show cumulative count of Article Views (full-text article views including HTML views, PDF and ePub downloads, according to the available data) and Abstracts Views on Vision4Press platform.
Data correspond to usage on the plateform after 2015. The current usage metrics is available 48-96 hours after online publication and is updated daily on week days.
Initial download of the metrics may take a while.