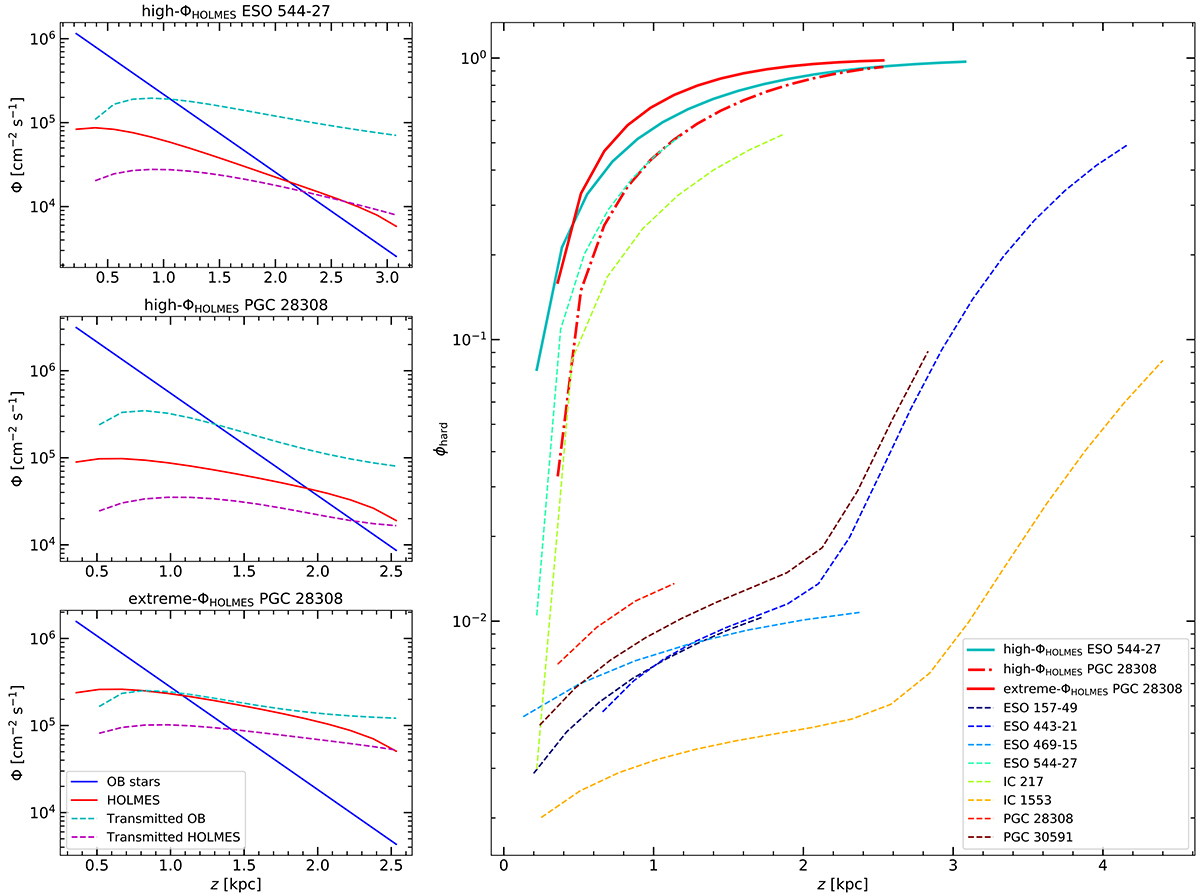
Fig. 13.
Download original image
Contributions of the different ionization sources over z for the models with enhanced ΦHOLMES. Top-left panel: contributions of different components to the ionizing radiation for the high-ΦHOLMES ESO 544−27 model. The blue solid line shows the contribution from midplane OB stars, the red solid line shows the contribution from HOLMES, and the cyan and magenta dashed lines show the contribution of transmitted emission from midplane OB stars and HOLMES, respectively. Middle-left panel: same as top-left panel but for the high-ΦHOLMES PGC 28308 model. Bottom-left panel: same as top-left panel but for the extreme-ΦHOLMES PGC 28308 model. Right panel: relative contribution of combined HOLMES radiation and transmitted radiation for all of our models ϕhard = (ΦHOLMES + Φt)/Φ. The thick cyan curve shows ϕhard for the high-ΦHOLMES ESO 544−27 model. The thick dash-dot red curve shows ϕhard for the high-ΦHOLMES PGC 28308 model. The thick solid red curve shows ϕhard for the extreme-ΦHOLMES PGC 28308 model. The dashed curves show ϕhard for the original models. Only models where ϕhard approaches unity are able to produce η > −0.5 in the eDIG.
Current usage metrics show cumulative count of Article Views (full-text article views including HTML views, PDF and ePub downloads, according to the available data) and Abstracts Views on Vision4Press platform.
Data correspond to usage on the plateform after 2015. The current usage metrics is available 48-96 hours after online publication and is updated daily on week days.
Initial download of the metrics may take a while.