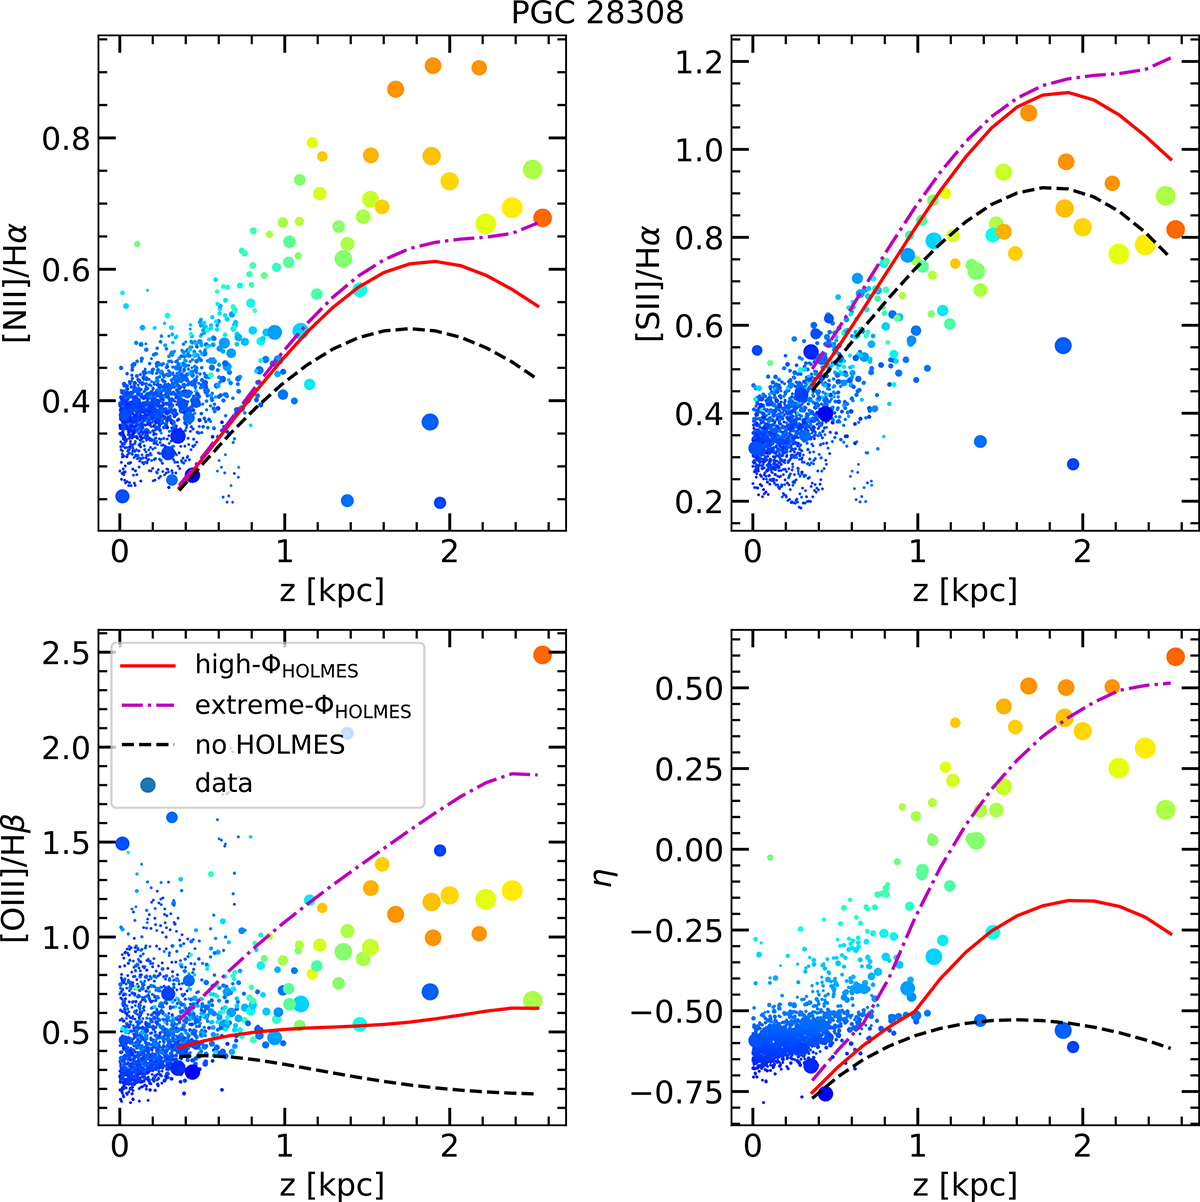
Fig. 12.
Download original image
Line ratio and η-parameter profiles for the best fit PGC 28308 models. The dots show the observed values, colored according to the η-parameter going from blue at low η to green at high η. The size of each dot is relative to the size of the corresponding Voronoi bin. The solid red curve shows the best fit high-ΦHOLMES model (χ2/ν = 156), the dash-dot magenta curve shows the best fit extreme-ΦHOLMES model (χ2/ν = 167), and the dashed black curve shows the best fit model without HOLMES (χ2/ν = 175). The best fit values are hzn = 1.2 kpc, fV = 0.14, and log U1 = −3.10 for the high-ΦHOLMES model, hzn = 1.9 kpc, fV = 0.14, and log U1 = −3.20 for the extreme-ΦHOLMES model, and hzn = 1.1 kpc, fV = 0.14, and log U1 = −3.10 for the model without HOLMES. The reasonable high-ΦHOLMES model fails to reproduce the high η-parameter in the eDIG of PGC 28308, and a model with unrealistically high ΦHOLMES/ΦOB is required to do so.
Current usage metrics show cumulative count of Article Views (full-text article views including HTML views, PDF and ePub downloads, according to the available data) and Abstracts Views on Vision4Press platform.
Data correspond to usage on the plateform after 2015. The current usage metrics is available 48-96 hours after online publication and is updated daily on week days.
Initial download of the metrics may take a while.