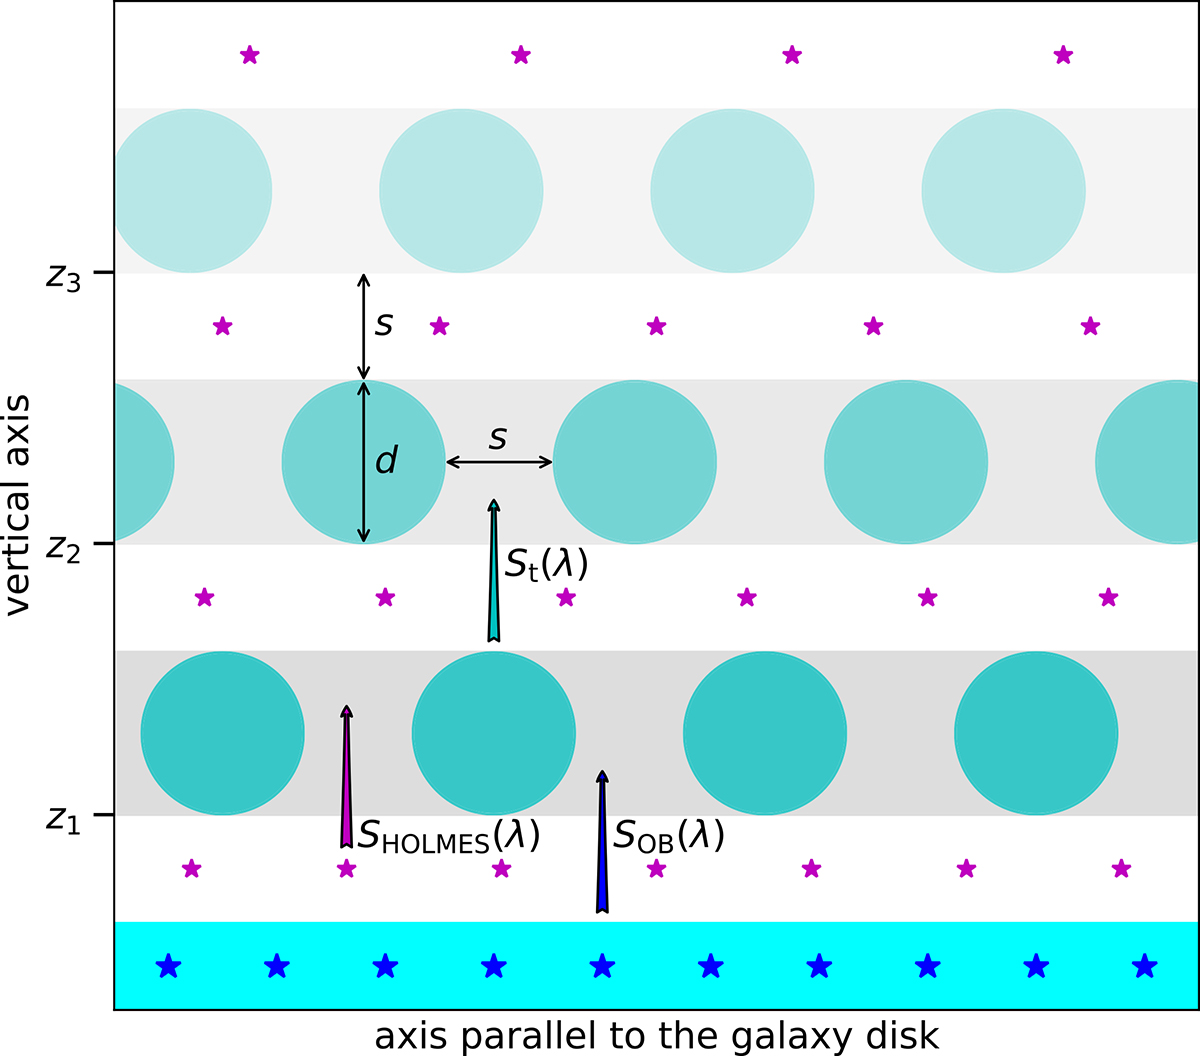
Fig. 1.
Download original image
Schematic of our model. The cyan shaded area indicates the star-forming disk and the large blue stars represent the OB stars within it. The gray shaded areas indicate the eDIG cloud layers, and the filled cyan circles show the eDIG clouds within them. The small purple stars represent the HOLMES between the cloud layers. The colored arrows indicate the source radiation fields of leaking midplane H II regions (SOB(λ); blue), HOLMES (SHOLMES(λ); magenta), and transmitted radiation (St(λ); cyan). Black arrows indicate the cloud diameter (d) and the layer separation (s).
Current usage metrics show cumulative count of Article Views (full-text article views including HTML views, PDF and ePub downloads, according to the available data) and Abstracts Views on Vision4Press platform.
Data correspond to usage on the plateform after 2015. The current usage metrics is available 48-96 hours after online publication and is updated daily on week days.
Initial download of the metrics may take a while.