Fig. 3.
Download original image
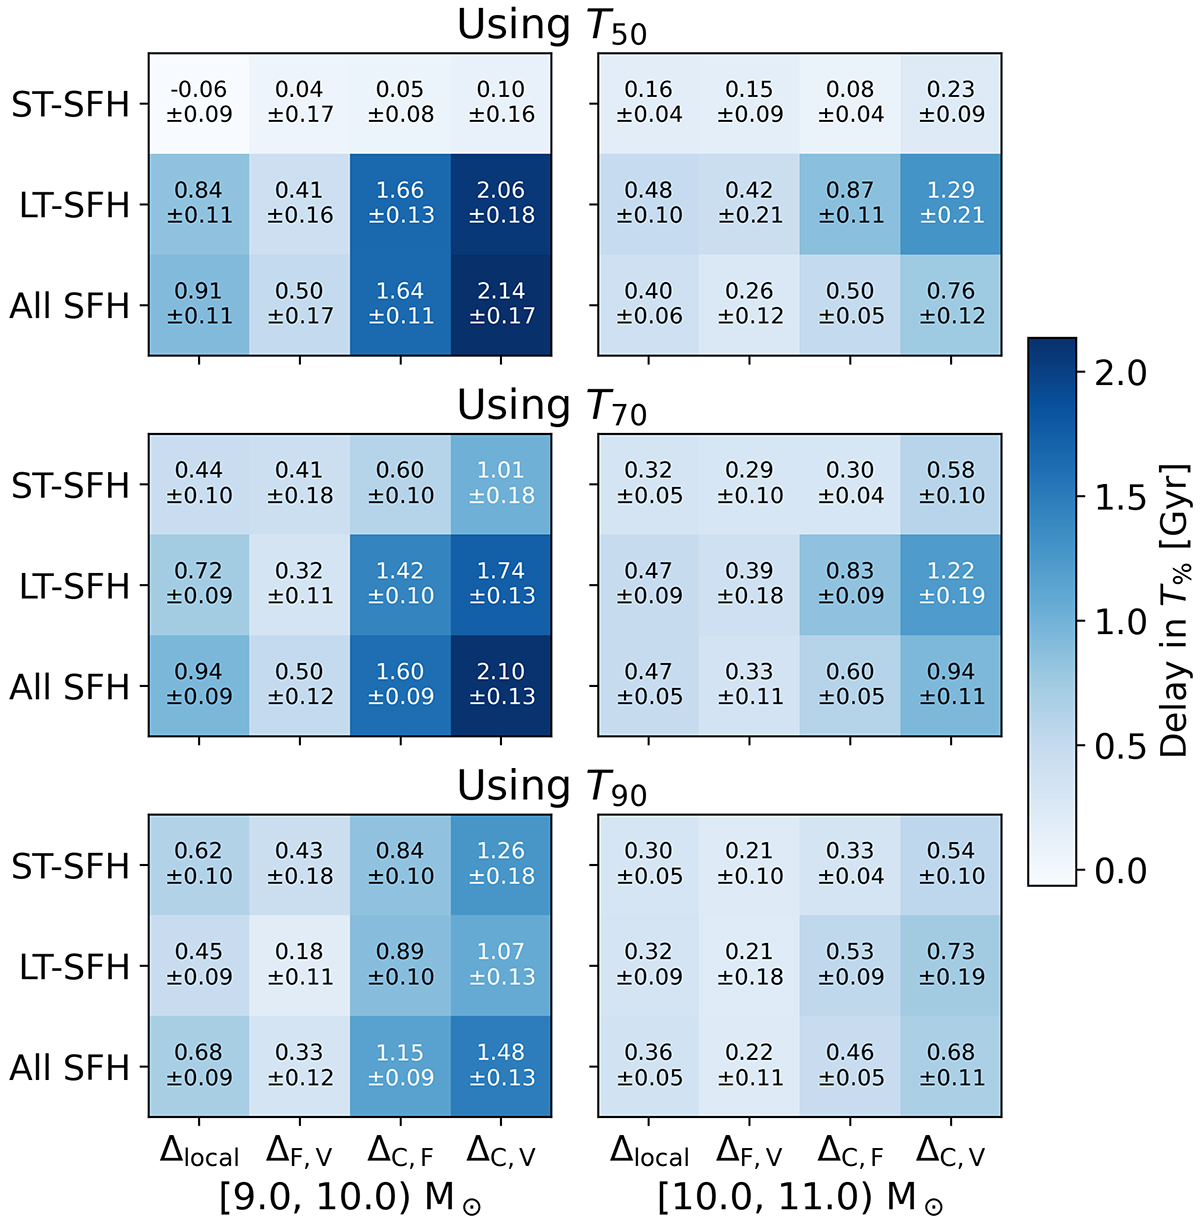
Delay in mean mass assembly look-back times caused by environment (Δenv). The results using T50, T70, and T90 appear in the first, second, and third panels, reading from top to bottom. We consider galaxies of low (109 − 1010 M⊙) and high masses (1010 − 1011 M⊙) on the left and right panels. Every column corresponds to a Δenv value, where C, F, and V depict clusters, filaments, and voids respectively, aiming to compare every LSS environment. Also, Δlocal corresponds to the difference between groups and singlets. Rows in every panel depict SFH types (short-timescale SFH, long-timescale SFH, or both altogether).
Current usage metrics show cumulative count of Article Views (full-text article views including HTML views, PDF and ePub downloads, according to the available data) and Abstracts Views on Vision4Press platform.
Data correspond to usage on the plateform after 2015. The current usage metrics is available 48-96 hours after online publication and is updated daily on week days.
Initial download of the metrics may take a while.