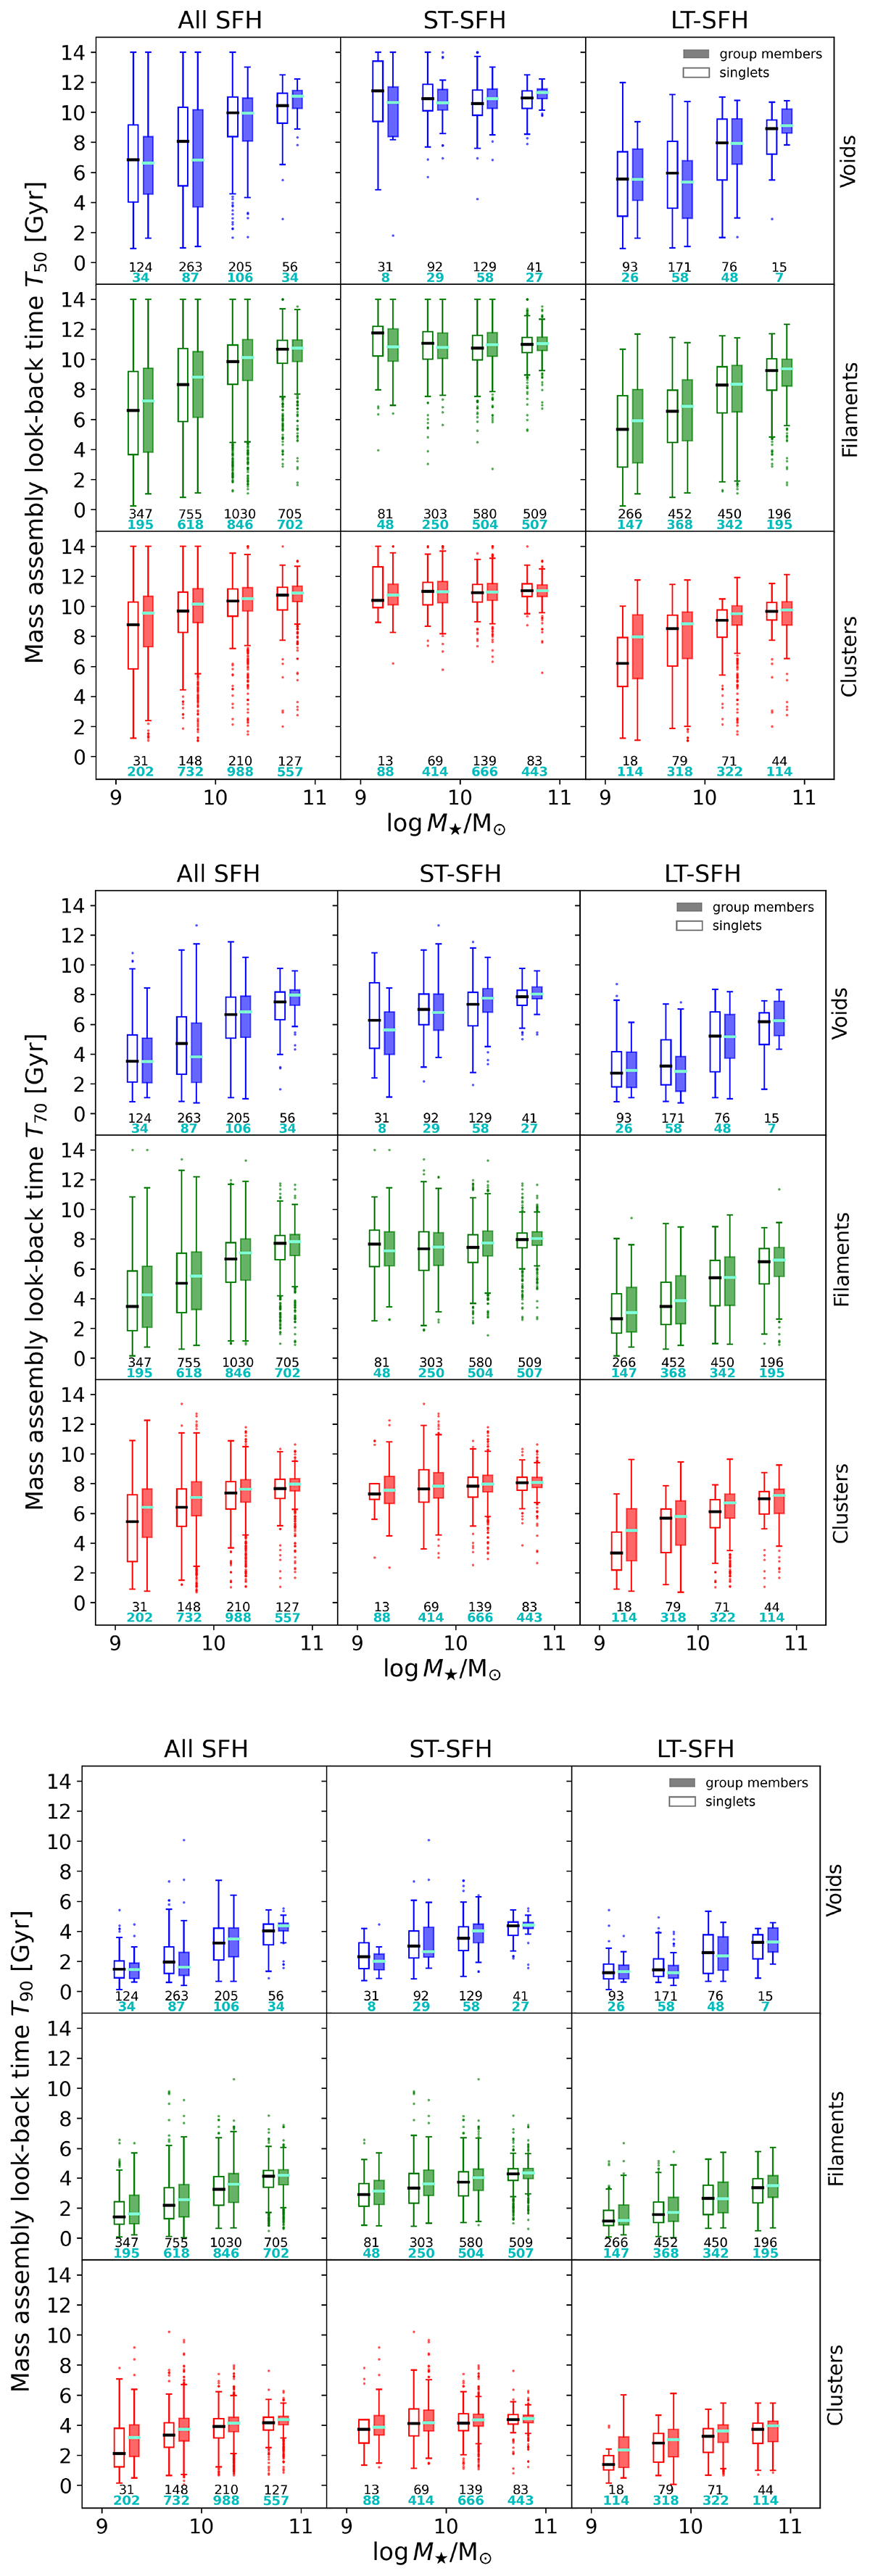
Fig. 2.
Download original image
Mass assembly look-back time distributions vs. stellar mass for singlets (empty boxes) and grouped galaxies (filled boxes) in voids (blue), filaments and walls (green) and clusters (red). Upper, middle and lower panels correspond to T50, T70 and T90 distributions, respectively. The stellar mass bins are distributed from 109 to 1011 M⊙, in 0.5 dex intervals. Numbers at the lower end of each panel correspond to the size of the subsamples (black for singlets and cyan for galaxies in groups).
Current usage metrics show cumulative count of Article Views (full-text article views including HTML views, PDF and ePub downloads, according to the available data) and Abstracts Views on Vision4Press platform.
Data correspond to usage on the plateform after 2015. The current usage metrics is available 48-96 hours after online publication and is updated daily on week days.
Initial download of the metrics may take a while.