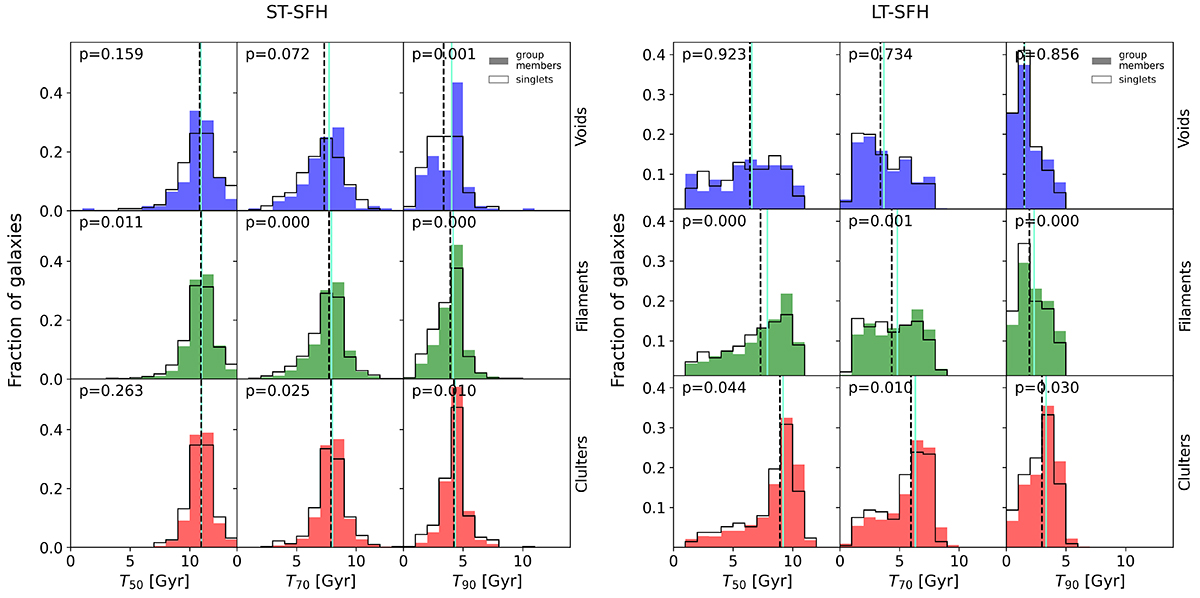
Fig. 1.
Download original image
Stellar mass assembly look-back time distributions (T50, T70, and T90) for singlets (black solid line) and galaxies in groups (colour-filled). Left: ST-SFH galaxies; Right: LT-SFH galaxies. The LSS environment is indicated on the right axis and is colour-coded (voids in blue, filaments and walls in green, and clusters in red). The median of the distribution appears in solid cyan (group members) and dashed black (singlets) vertical lines. The values on the upper left corner correspond to the p-value from the Kolmogorov-Smirnov tests conducted between singlets and grouped galaxies distributions in each subpanel. All distributions contain over 150 galaxies.
Current usage metrics show cumulative count of Article Views (full-text article views including HTML views, PDF and ePub downloads, according to the available data) and Abstracts Views on Vision4Press platform.
Data correspond to usage on the plateform after 2015. The current usage metrics is available 48-96 hours after online publication and is updated daily on week days.
Initial download of the metrics may take a while.