Open Access
Fig. 2
Download original image
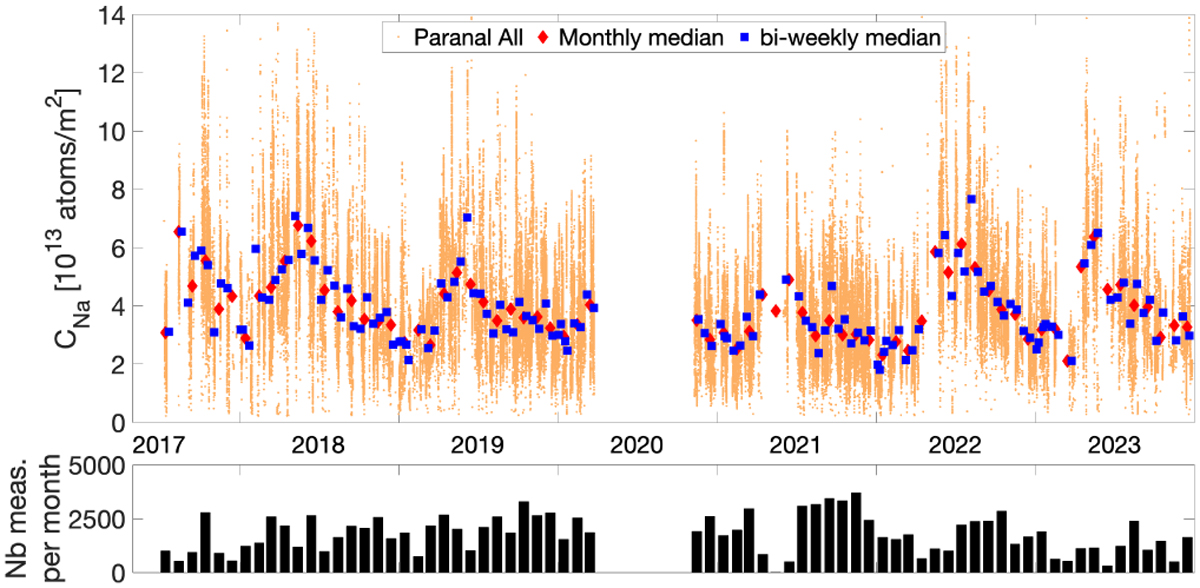
Na vertical column density versus time measured at Paranal (top): all available measurements (orange dots), monthly median (red diamonds) and 15-day median (blue squares); number of measurements for each monthly median (bottom).
Current usage metrics show cumulative count of Article Views (full-text article views including HTML views, PDF and ePub downloads, according to the available data) and Abstracts Views on Vision4Press platform.
Data correspond to usage on the plateform after 2015. The current usage metrics is available 48-96 hours after online publication and is updated daily on week days.
Initial download of the metrics may take a while.