Open Access
Fig. 15
Download original image
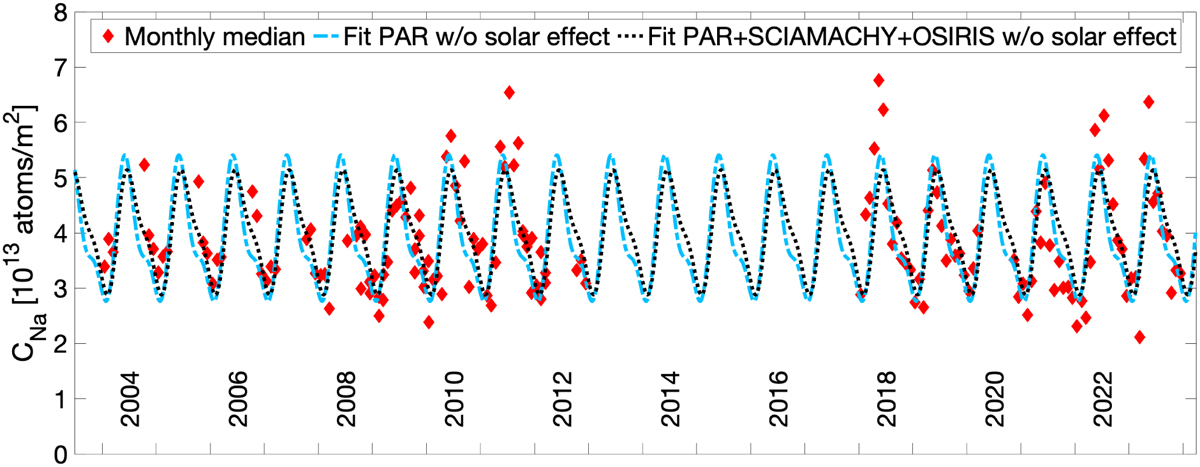
Monthly Na vertical column density versus time measured at latitude of 24.6°S, gathering the Paranal, SCIAMACHY, and OSIRIS data (red diamonds); model derived from fitting only the Paranal monthly medians (blue dashed line) and from fitting the monthly medians of the three datasets together (black dotted line).
Current usage metrics show cumulative count of Article Views (full-text article views including HTML views, PDF and ePub downloads, according to the available data) and Abstracts Views on Vision4Press platform.
Data correspond to usage on the plateform after 2015. The current usage metrics is available 48-96 hours after online publication and is updated daily on week days.
Initial download of the metrics may take a while.