Fig. 13
Download original image
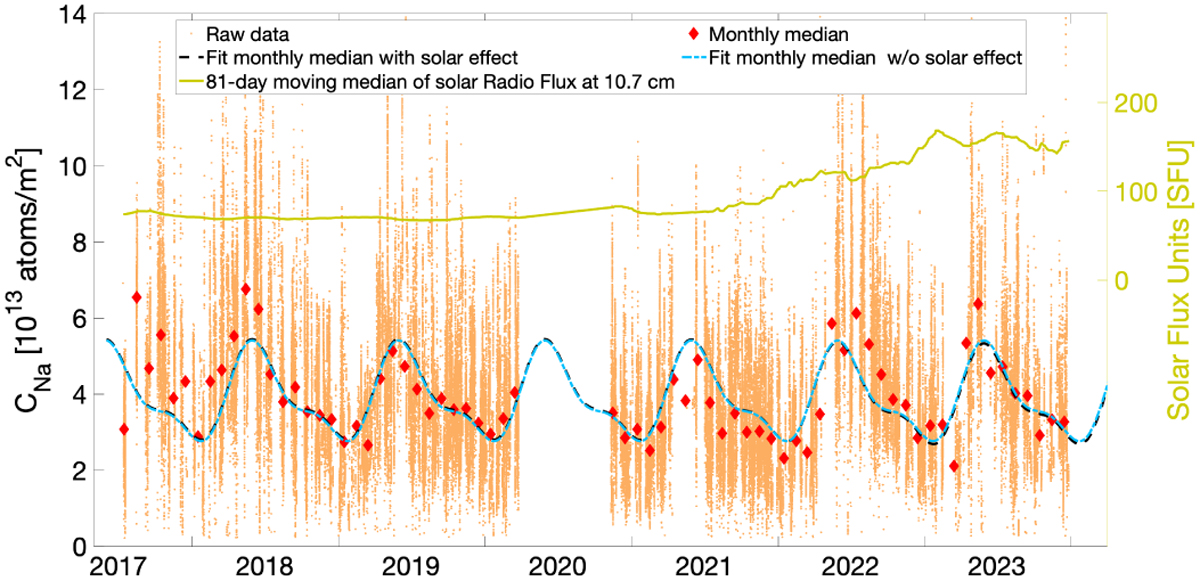
Na vertical column density at Paranal. All data (orange dots), monthly median (red diamonds), and two fitting scenarios: considering the solar cycle (black dashed line) and not considering the solar cycle (blue solid line). Solar activity is indicated by the 81-day moving median of the solar flux at 10.7 cm measured in solar flux units (SFU).
Current usage metrics show cumulative count of Article Views (full-text article views including HTML views, PDF and ePub downloads, according to the available data) and Abstracts Views on Vision4Press platform.
Data correspond to usage on the plateform after 2015. The current usage metrics is available 48-96 hours after online publication and is updated daily on week days.
Initial download of the metrics may take a while.