Fig. 4.
Download original image
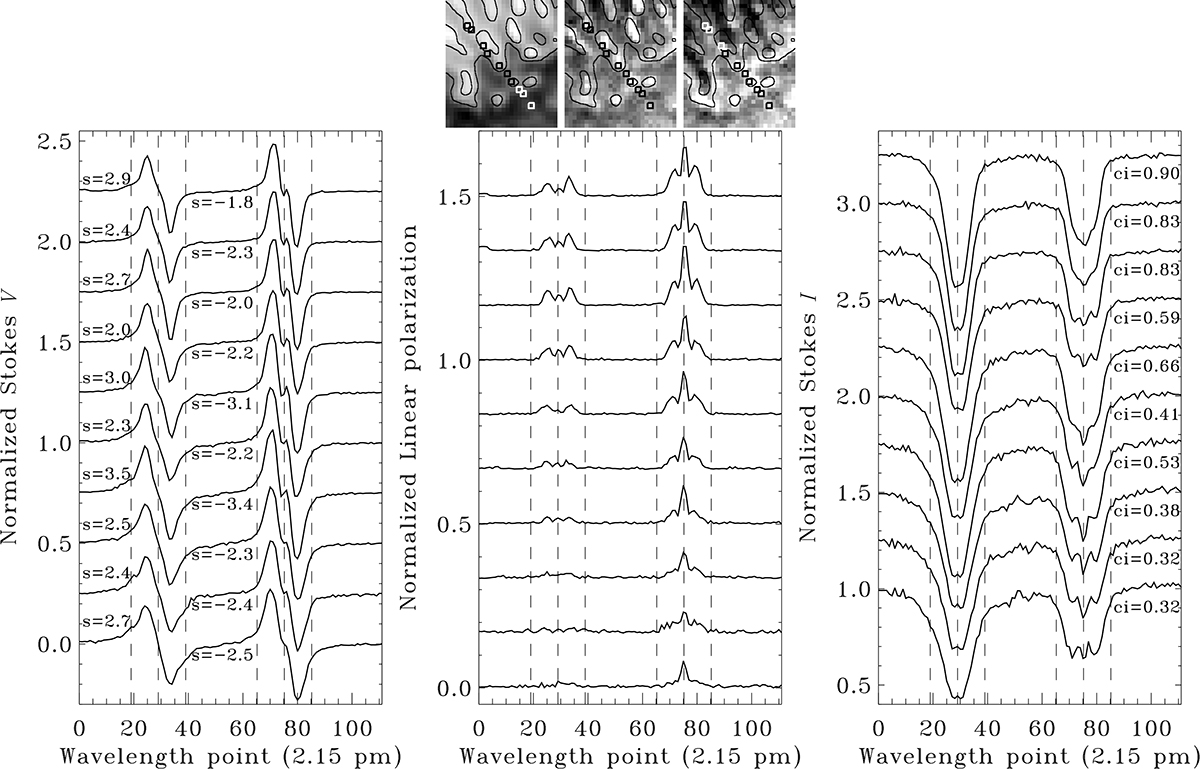
Stokes profiles of selected pixels from area C1. The upper row displays 2D maps, which from left to right show continuum intensity, and blue- and red-wing magnetograms constructed from the first spectral line at −215 and +215 mÅ away from the line center, respectively. For ease of comparison, the negative of the red-wing magnetogram is shown. The same black or white curves are drawn to compare the locations of fine structures. The size of the selected area is 17 × 21 pixels, equivalent to 1.3 × 2.5 arcsec2. The lower row shows, from left to right, profile arrays of Stokes V, linear polarization (LP = ![]() ), and Stokes I. Each Stokes profile is normalized to its own local Stokes I continuum. The pixels whose Stokes profiles are drawn are marked with small white/black square symbols in the maps of the upper row. Stokes profiles shown from bottom to top correspond to the pixels running from umbra (lower-right corner) to penumbra (upper-left corner). Three vertical dashed lines show the zero-velocity reference and ±215 mÅ around it in both spectral lines. Numerical values in the panel showing the profile array of Stokes V are the signal values (multiplied by 100) at far blue and red wings at ±215 mÅ. Also, the corresponding values of the continuum intensities are shown in the Stokes I panel. For ease of comparison, the Stokes profiles in the panels showing profile arrays are sorted with a fixed step of 0.25, 0.17, and 0.25, from the left to the right panel, respectively.
), and Stokes I. Each Stokes profile is normalized to its own local Stokes I continuum. The pixels whose Stokes profiles are drawn are marked with small white/black square symbols in the maps of the upper row. Stokes profiles shown from bottom to top correspond to the pixels running from umbra (lower-right corner) to penumbra (upper-left corner). Three vertical dashed lines show the zero-velocity reference and ±215 mÅ around it in both spectral lines. Numerical values in the panel showing the profile array of Stokes V are the signal values (multiplied by 100) at far blue and red wings at ±215 mÅ. Also, the corresponding values of the continuum intensities are shown in the Stokes I panel. For ease of comparison, the Stokes profiles in the panels showing profile arrays are sorted with a fixed step of 0.25, 0.17, and 0.25, from the left to the right panel, respectively.
Current usage metrics show cumulative count of Article Views (full-text article views including HTML views, PDF and ePub downloads, according to the available data) and Abstracts Views on Vision4Press platform.
Data correspond to usage on the plateform after 2015. The current usage metrics is available 48-96 hours after online publication and is updated daily on week days.
Initial download of the metrics may take a while.