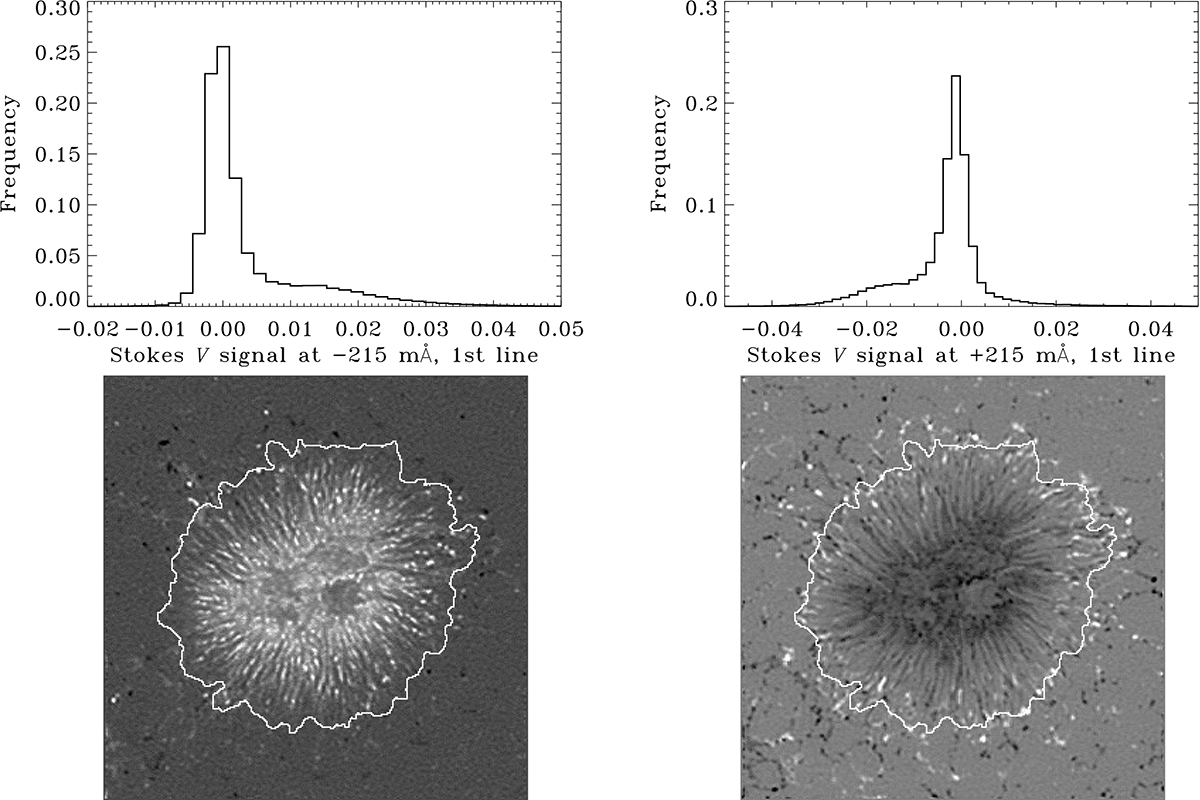
Fig. 3.
Download original image
Blue- and red-wing magnetograms. Upper row: histograms of Stokes V signals at wavelengths of −215 (left panel) and +215 mÅ (right panel) relative to the line core at 630.15 nm. Lower row: 2D images of Stokes V signals at the same wavelengths. The white contours show the boundary of the penumbra-quiet Sun. Histograms correspond to the entire region shown in the lower row.
Current usage metrics show cumulative count of Article Views (full-text article views including HTML views, PDF and ePub downloads, according to the available data) and Abstracts Views on Vision4Press platform.
Data correspond to usage on the plateform after 2015. The current usage metrics is available 48-96 hours after online publication and is updated daily on week days.
Initial download of the metrics may take a while.